
What Would It Take to Deliver the GC–SCGC Synergy Target?
OSVARD compares four operating cases against USD 150–200 million a year, separating routes without personnel reductions from cases that permit them.

The short version
- Cases 1 and 2 exclude personnel reductions.
- Case 3 combines purchasing and logistics with personnel savings, while Case 4 relies on personnel savings alone.
- Each tests USD 150 million and USD 200 million a year. They do not yet establish the combined company’s resulting profit or the operating feasibility of the required changes.
The question behind the study
A plant can already be well run while the business around it still has room to change. That distinction sits at the center of the proposed GC–SCGC combination. A larger organization may coordinate purchasing, production, and customers differently, but common ownership alone does not establish how much additional value those decisions can create.
OSVARD examines the annual synergy target through four operating cases. Cases 1 and 2 exclude personnel reductions. Case 3 combines purchasing and logistics with personnel savings, while Case 4 relies on personnel savings alone. Each tests USD 150 million and USD 200 million a year. The purpose is to show the requirement under each condition and the information needed to judge whether it can be delivered.
The public starting point comes before the case studies
GC and SCGC announced the proposed combination of selected Thai olefins and polyolefins businesses on 29 October 2026. The announced ownership is 56% GC and 44% SCGC, with establishment targeted for the second half of 2027, subject to approvals and conditions. The companies expect approximately USD 150–200 million in annual synergies, progressively realized over about three years. Those amounts provide the two study targets. GC and SCGC proposed combination announcement
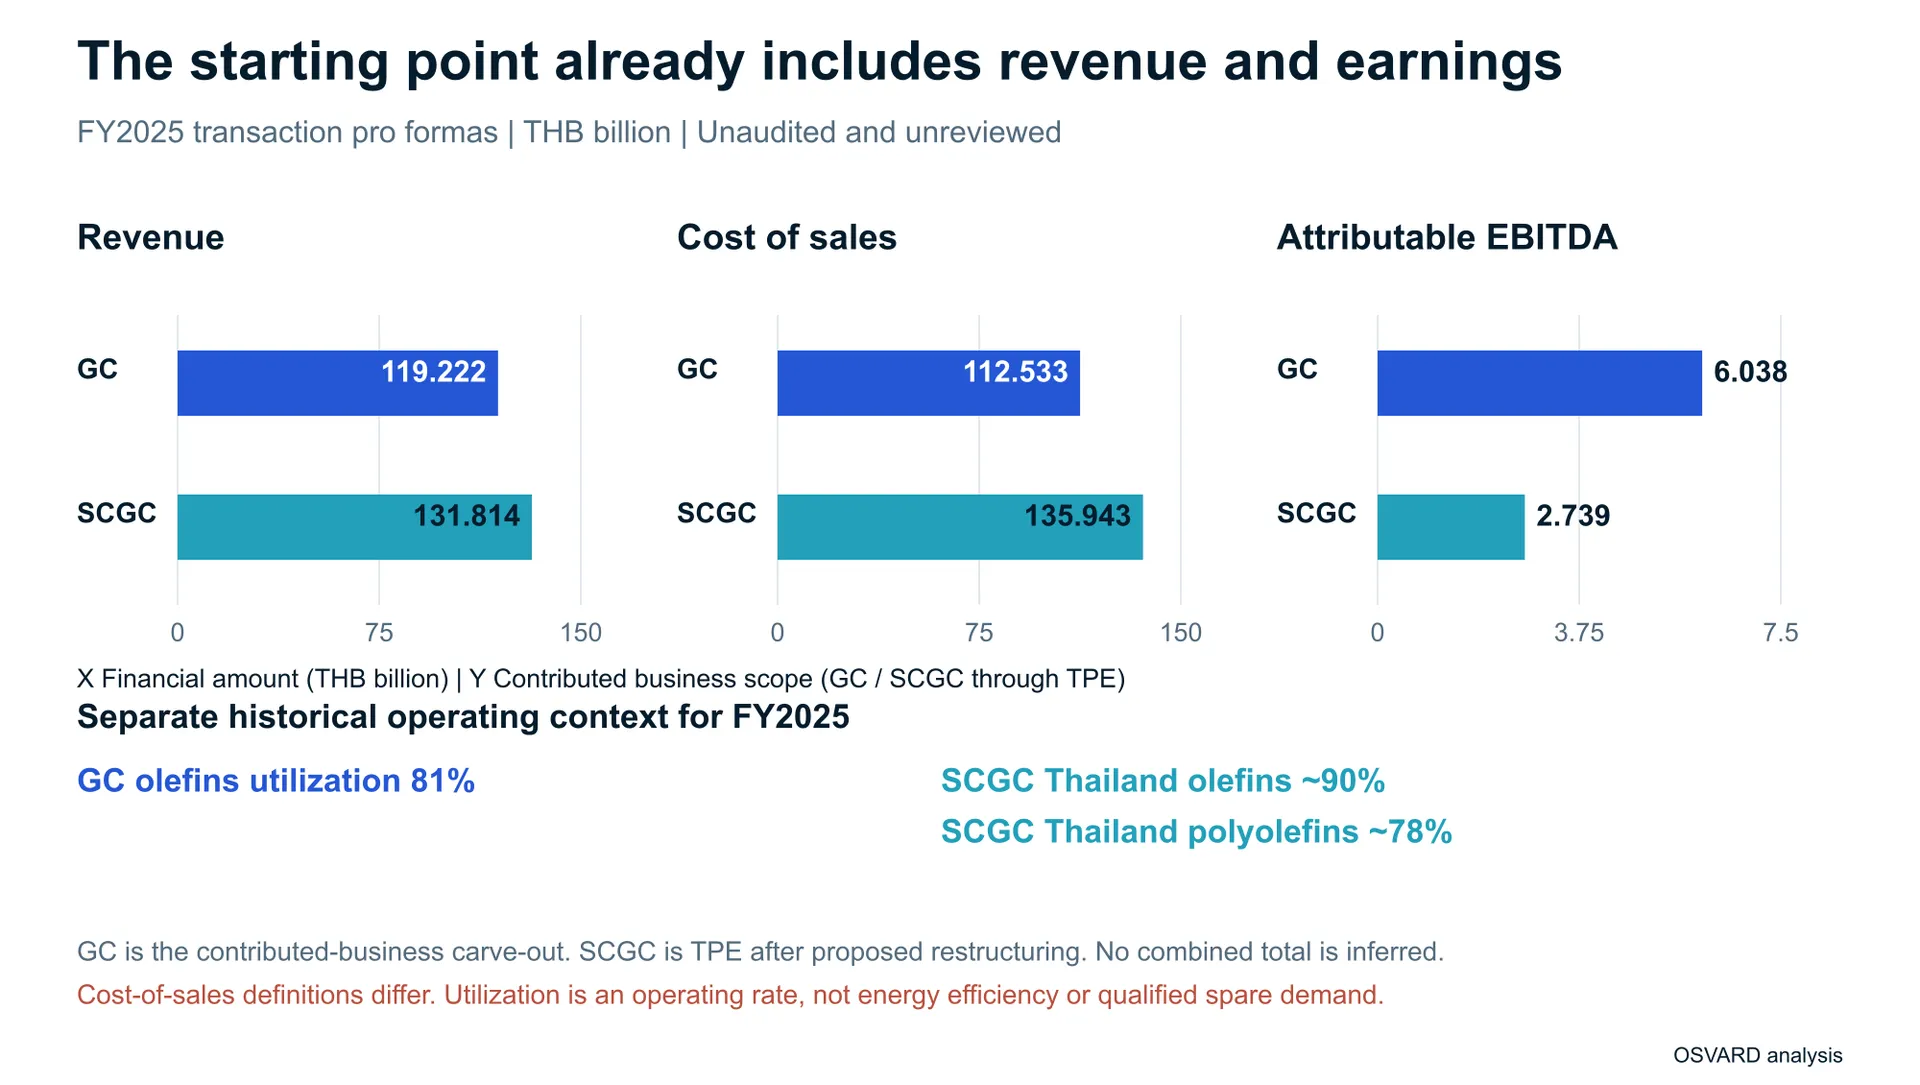
The starting financial reference is the transaction filing’s FY2025 presentation of the contributed GC business and TPE after the proposed SCGC restructuring. Both are management-prepared, unaudited, and unreviewed pro formas. They describe the intended contribution scope, with accounting and consolidation adjustments, rather than a matched set of actual plant cash-cost accounts. GC transaction filing and financial references
The disclosed financial starting point
| FY2025 reference in THB million | GC contributed-business carve-out | TPE after SCGC restructuring |
|---|---|---|
| Revenue | 119,222 | 131,814 |
| Cost of sales as presented | 112,533 | 135,943 |
| Selling and administrative expenses as presented | 1,680 | 4,198 |
| EBITDA reported in the FY2025 transaction pro forma | 5,619 | (2,862) |
| Attributable EBITDA as defined in the filing | 6,038 | 2,739 |
How to read the financial reference
The SCGC-side column represents the business set intended for contribution through TPE after restructuring. Before the merger, SCGC will transfer specified shareholdings into TPE. The reference therefore covers TPE’s own manufacturing and the relevant subsidiaries and joint-venture investments. It does not refer to TPE manufacturing alone. GC transaction filing and financial references
The EBITDA row is the amount reported in the FY2025 transaction pro forma, before any additional merger benefit in this study. Attributable EBITDA is a separate filing-defined measure that includes specified proportionate affiliate contributions. It is not net profit or cash available for distribution. GC’s cost of sales and administrative expenses exclude depreciation and amortization; an equivalent exclusion is not stated for TPE. The figures therefore do not provide a harmonized cash-cost base. GC transaction filing and financial references
Chart sources are GC transaction filing and financial references · GC FY2025 One Report · SCC FY2025 One Report English.
The starting point already includes revenue and earnings
 Open figure at full size (opens in a new tab)
Existing improvements belong in the baseline
The before-integration comparison must also retain improvements already planned or achieved independently. GC reported more than THB 7 billion of revenue-enhancement and cost-reduction benefits in 2025. SCGC reported THB 1,860 million from operating-improvement projects. GC’s previously announced ethane-sourcing project is another standalone-plan item. Their scopes differ, and none is automatically an additional merger benefit. GC standalone operating and improvement update · SCC Q4/FY2025 MD&A · GC SET Digital Roadshow FY2024
The financial starting point matters because it shows the scale and earnings position of the proposed contributions. It does not reveal how much each plant can save. Public capacity, utilization, and entity accounts help identify the operating perimeter, but a plant-level saving still needs its own eligible expense, contractual terms, and change in activity. The workbook keeps those records separate from the amounts tested in the charts.
Four cases define different routes to the same target
Four cases define different permitted actions
 Open figure at full size (opens in a new tab)
What each case permits
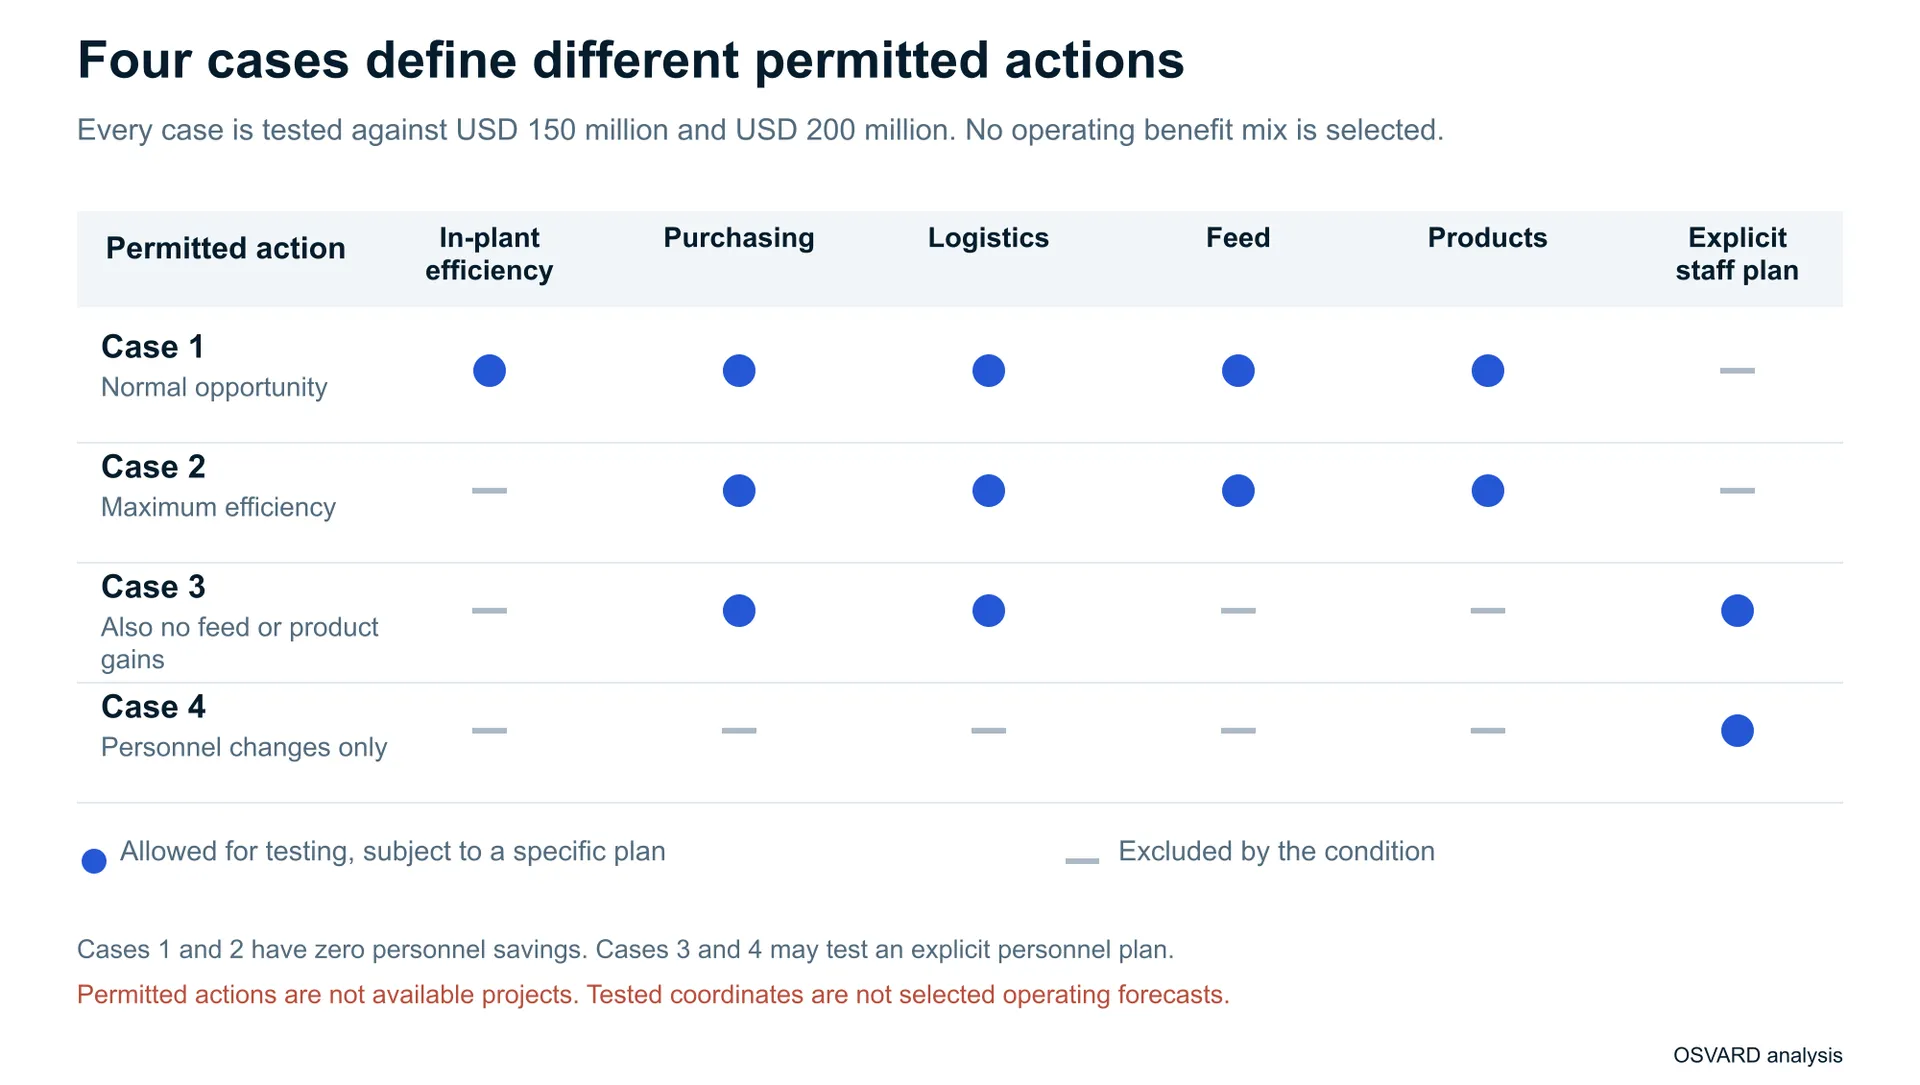
The case numbers describe different conditions rather than a single sequence of cuts. Case 1 allows additional physical improvements and commercial gains without reducing personnel. Case 2 accepts that the plants already operate at maximum efficiency, including heat integration, and still excludes personnel reductions. Case 3 removes physical, feed, and product gains but introduces personnel savings. Case 4 places the entire requirement on personnel.
The personnel exclusions in Cases 1 and 2 are conditions of this study. They are not company employment commitments or forecasts of the actual post-merger workforce.
Four non-personnel amounts are kept separate. Physical benefit means merger-incremental changes beyond the standalone plan. Purchasing and logistics benefit excludes personnel and feed discounts counted elsewhere. Net feed contribution includes feed, coproduct, processing, and transport effects. Net product contribution includes additional manufacturing, qualification, service, and selling costs. A change in an internal transfer price alone creates no benefit for the combined business.
For Cases 1 and 2, annual operating benefit equals the permitted contributions less recurring program expense. A positive target gap remains an unfunded requirement; the model cannot fill it with personnel savings. For Cases 3 and 4, personnel savings may cover the permitted remainder. The charts test annual amounts before tax, with recurring program expense set to zero for readability. That zero is a test condition, not a disclosed integration budget.
Case 1 pursues operating and commercial gains without reducing personnel
Case 1 gives the integration team the broadest non-personnel opportunity set. Additional plant improvements, purchasing and logistics changes, feed choices, and product contribution may all be investigated. Personnel savings are fixed at zero. The business must therefore meet the target through these operating and commercial channels after recurring program expense.
The practical work starts with the standalone plan. A physical project needs measured consumption and an improvement caused by integration. A purchasing project needs comparable categories, volumes, and service terms. Feed and product projects need eligible volumes and net contribution after their additional costs. Existing improvements cannot be credited again, and overlapping benefits must be removed before the projects are added together.
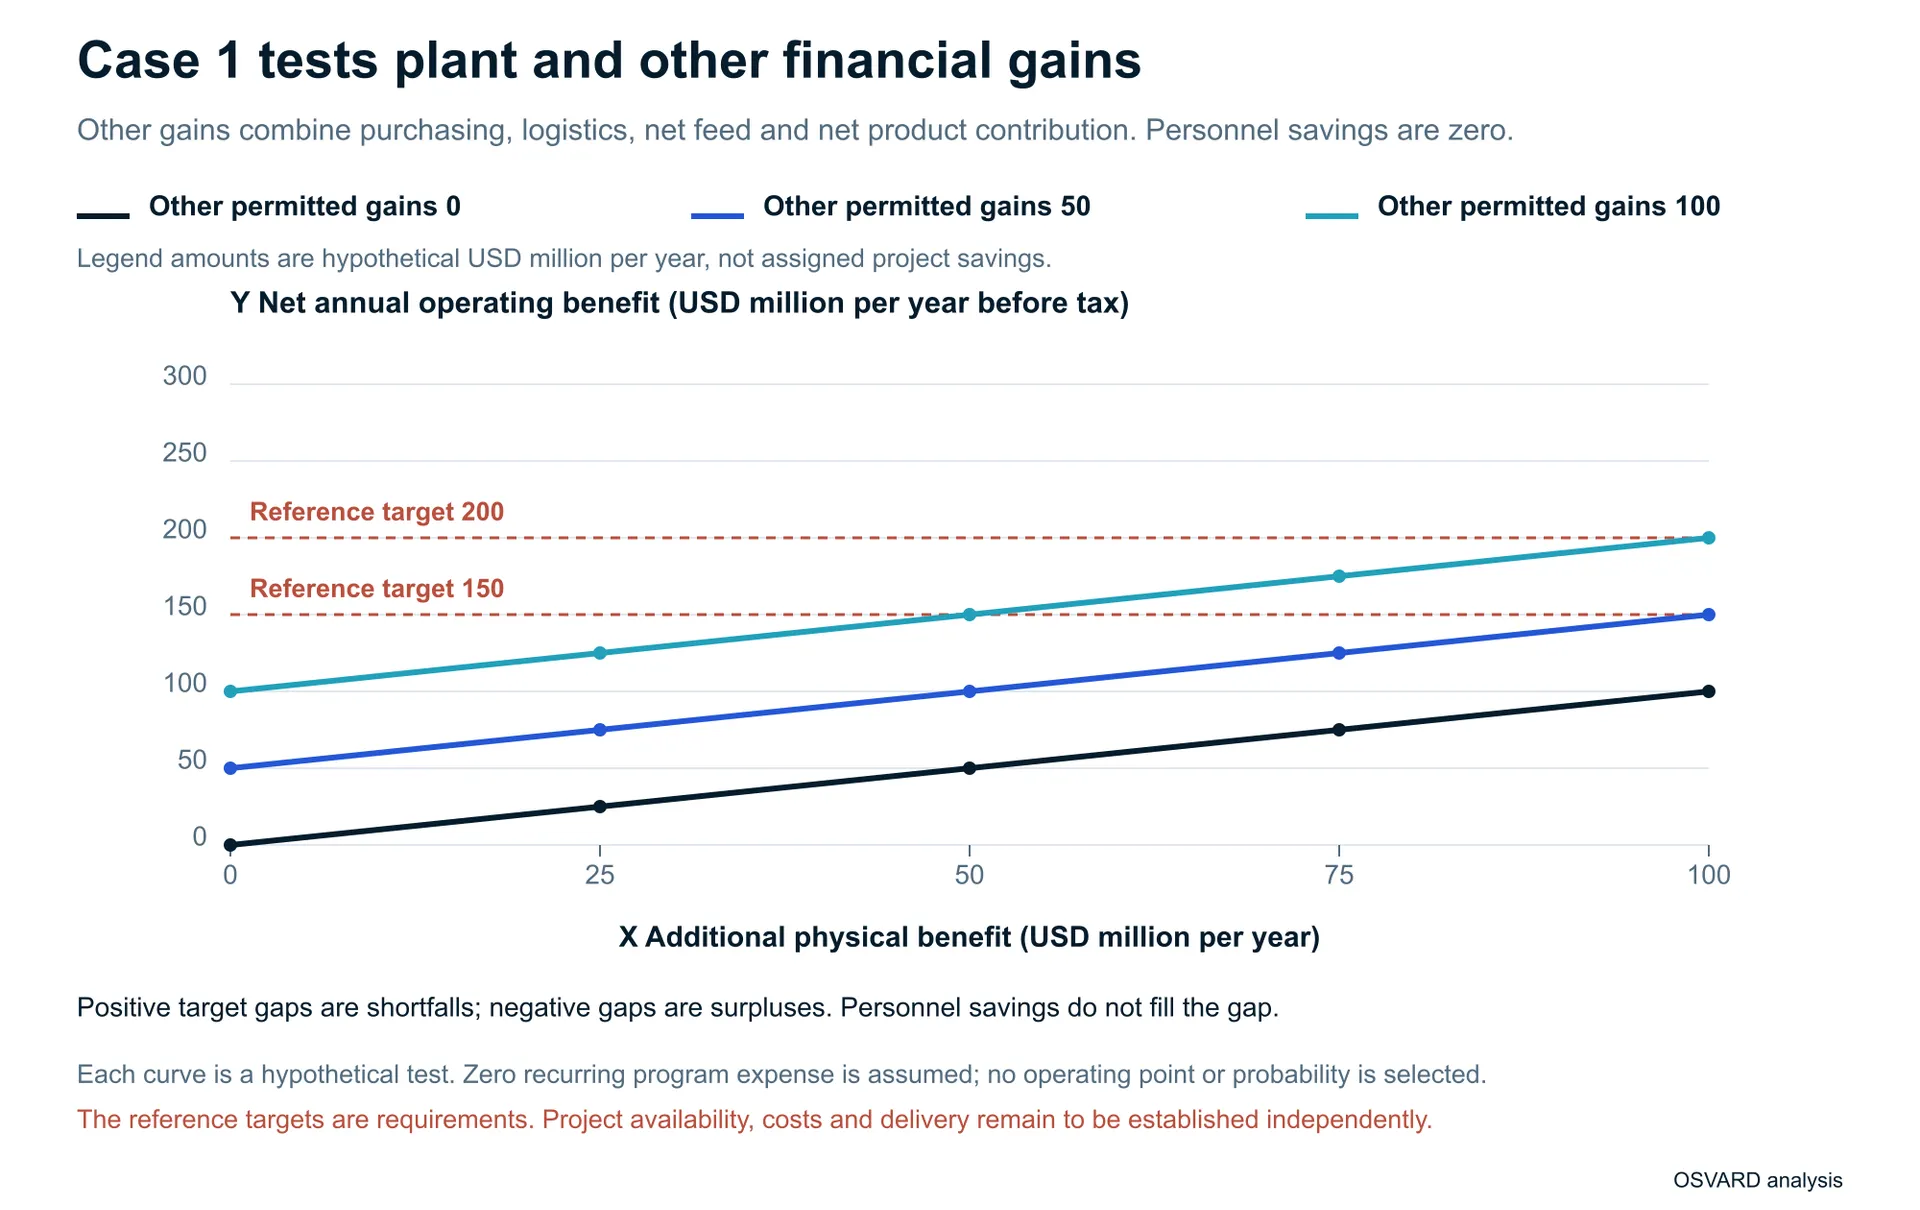
In the Case 1 graph, the X-axis is additional physical benefit in USD million per year. The Y-axis is net annual operating benefit in the same units. Each colored line holds the combined purchasing, logistics, net feed, and net product contribution at a tested amount. The horizontal reference lines mark the two targets. A point reaches a target only when it lies on or above that target line.
Case 1 tests plant and other financial gains
 Open figure at full size (opens in a new tab)
Case 1 annual benefit and target gaps
| Physical benefit | Other permitted contributions | Net annual benefit | Result against 150 | Result against 200 |
|---|---|---|---|---|
| 25 | 50 | 75 | Shortfall 75 | Shortfall 125 |
| 50 | 100 | 150 | At target | Shortfall 50 |
| 100 | 100 | 200 | Surplus 50 | At target |
What the Case 1 tests require
All amounts in this table are USD million per year at zero recurring program expense. Testing 25 of physical benefit and 50 from the other channels produces 75, leaving shortfalls of 75 and 125. Testing 50 plus 100 reaches 150 but leaves 50 to reach 200. These are arithmetic conditions. The graph does not establish that the required physical or commercial projects exist.
An inverse calculation makes the task clearer. If the other channels independently support 100 a year, physical projects must supply another 50 for the lower target or 100 for the higher one. If the plants have no further physical opportunity, those amounts must come from another permitted non-personnel channel. Case 1 contains no personnel fallback.
Case 2 accepts maximum plant efficiency and retains all personnel
Case 2 adopts the industry concern that existing plants may already be operating at their practical efficiency limits. Additional process and heat-integration benefit is fixed at zero, alongside personnel savings. Purchasing and logistics, net feed contribution, and net product contribution must carry the entire target after recurring expense.
Integration may change a network decision even when it cannot improve an individual unit. A feed allocation is valuable only if the combined external contribution improves after processing, transport, and coproduct consequences. A product change needs qualified demand and a net premium after additional costs. Equipment limits, partner rights, licenses, and customer approvals still determine which changes are accessible. The study assigns none of these opportunities a forecast value without the supporting inputs.
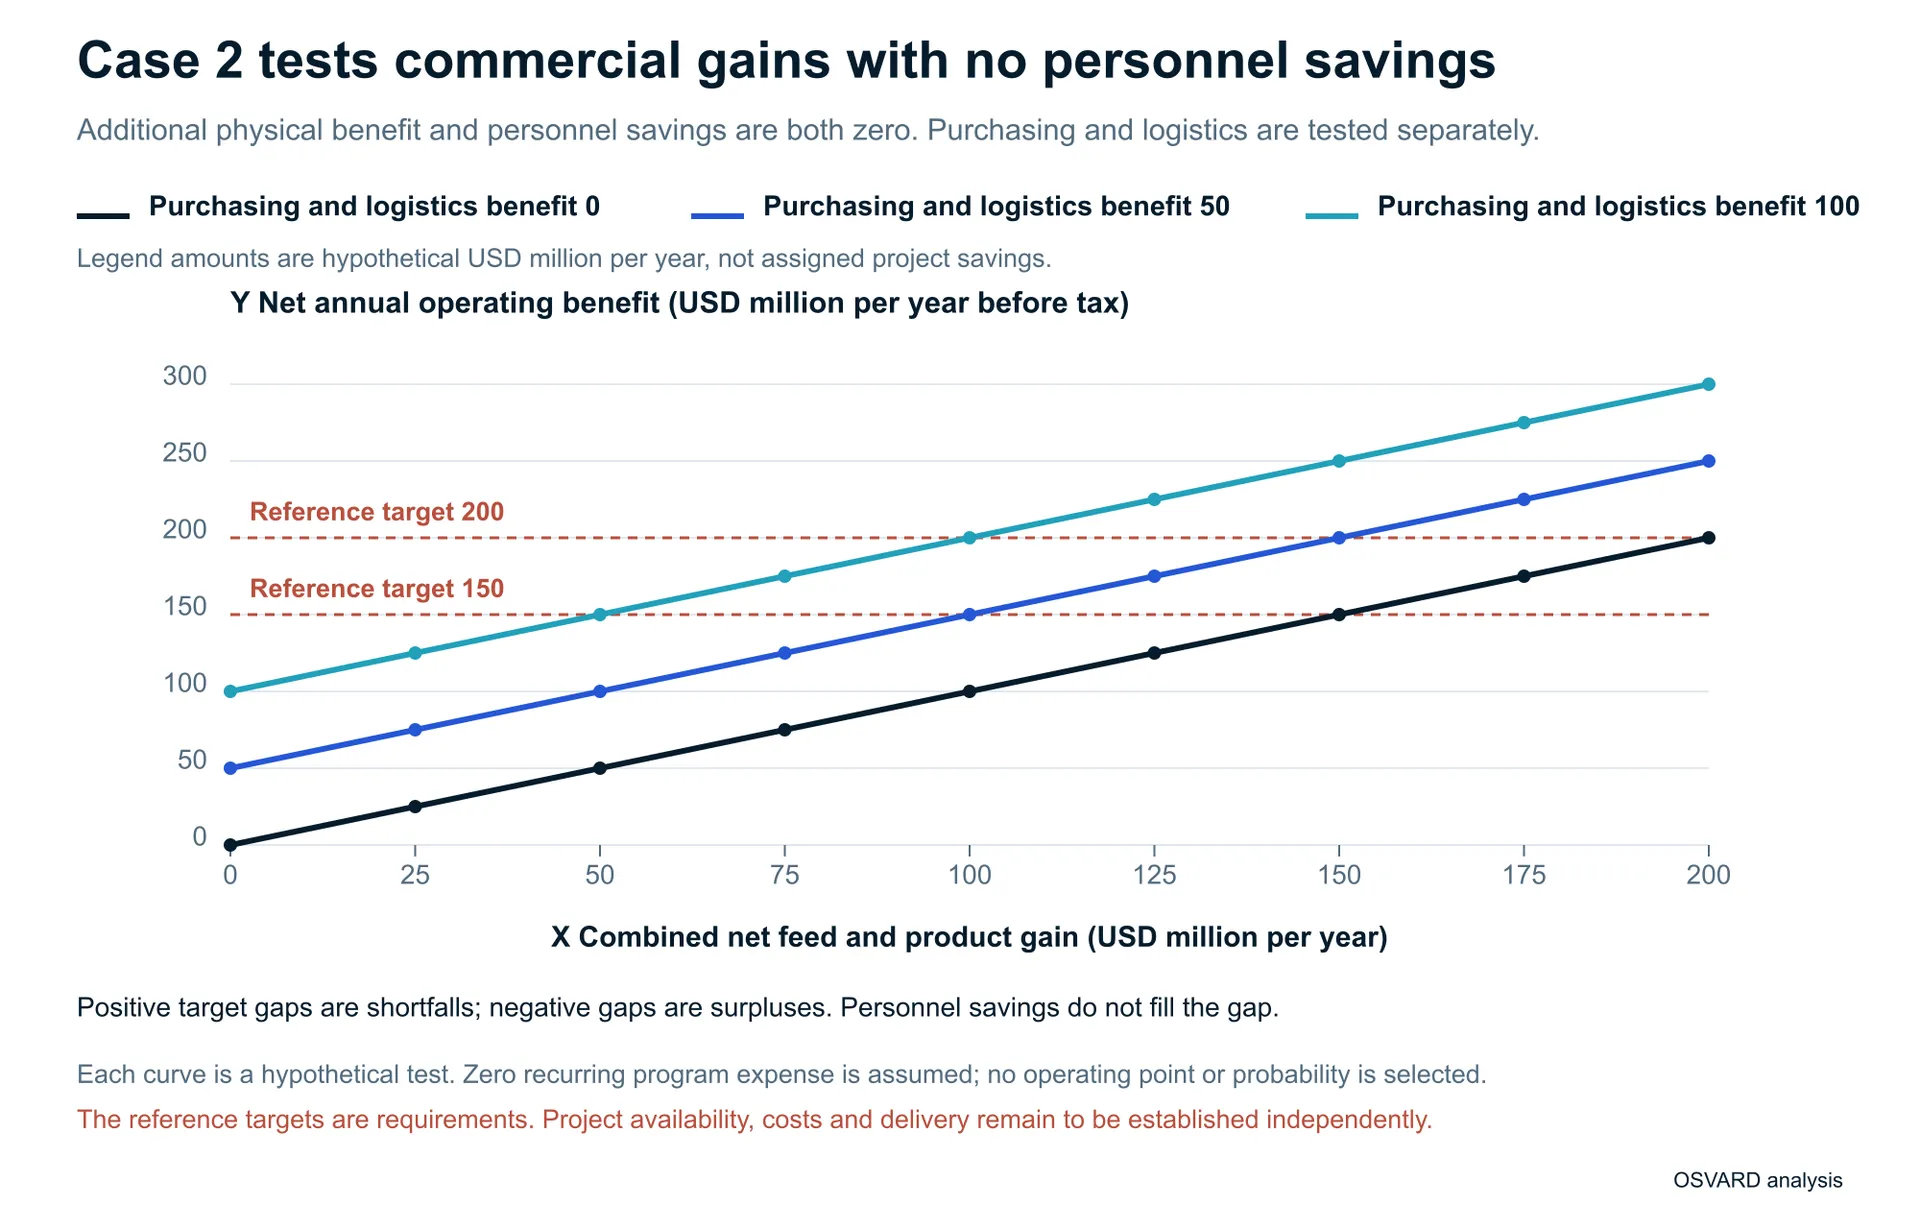
The Case 2 X-axis tests combined net feed and product contribution in USD million per year. The Y-axis shows net annual operating benefit before tax in the same units. Three lines test purchasing and logistics at 0, 50, and 100. Both target lines are on the same graph, so the reader can see the commercial requirement without translating a workforce percentage.
Case 2 tests commercial gains with no personnel savings
 Open figure at full size (opens in a new tab)
Case 2 annual benefit and target gaps
| Purchasing and logistics | Net feed plus product | Net annual benefit | Result against 150 | Result against 200 |
|---|---|---|---|---|
| 50 | 0 | 50 | Shortfall 100 | Shortfall 150 |
| 50 | 50 | 100 | Shortfall 50 | Shortfall 100 |
| 50 | 100 | 150 | At target | Shortfall 50 |
| 50 | 150 | 200 | Surplus 50 | At target |
What the Case 2 tests require
At a tested purchasing/logistics benefit of 50, another 100 of net feed and product contribution is required to reach 150, or 150 to reach 200. If commercial contribution is only 50, the result is 100 and misses both targets. Every amount is in USD million per year under the chart conditions. The case can reach either target mathematically; the public disclosures do not yet demonstrate the required commercial package.
The workforce reference applies only to Cases 3 and 4
The public data do not establish the complete workforce and avoidable payroll of the future venture. To make the requested calculations inspectable, the illustrations use historical global-group headcounts and selected employee-expense estimates. The Excel also retains an actual-JV input mode, which needs the matched population and payroll before it can be used.
The historical workforce reference
| Reference and classification | GC | SCGC |
|---|---|---|
| FY2025 year-end global employees, reported | 10,066 | 8,615 |
| Selected normalized employee expense, derived THB million | 26,299 | 11,305 |
| Average of opening and closing headcounts, derived | 10,562 | 8,737.5 |
| Annual reference cost per person, derived THB million | 2.49 | 1.29 |
How the personnel reference is calculated
The cost calculation divides selected normalized employee expenses by the average of opening and closing group headcounts. It covers employee levels across each group. The denominator is a two-point average rather than a measured monthly workforce, and the numerator is an accounting-expense estimate rather than verified avoidable cash payroll. SCGC’s separately reported THB 8,329.86 million of monetary remuneration has a different definition and remains a separate input. GC FY2025 One Report · GC FY2024 One Report · SCGC FY2025 One Report · SCGC FY2024 One Report
The personnel illustrations test THB 34 per USD, removal of 100% of the selected average employee cost, and zero recurring program expense unless stated otherwise. These are analytical assumptions. The same unrounded reduction percentage is applied to each company’s global population, then required roles are rounded upward separately. This sharing rule covers employee levels across each group. It does not follow the 56/44 ownership split or minimize the number of roles.
The requirement is the target plus recurring expense, less the permitted non-personnel contribution. Any positive remainder is divided by the average cost that is assumed to disappear. Case 3 graph percentages use rounded roles divided by the combined historical global workforce of 18,681. Case 4 company percentages use each company’s own population. Neither is a measured percentage of the future venture’s workforce.
Case 3 leaves purchasing and logistics alongside personnel
Case 3 keeps the maximum-efficiency condition and also fixes additional feed and product contribution at zero. The remaining non-personnel source is purchasing and logistics. This creates a direct relationship between independently established contract savings and the personnel saving still required.
The purchasing/logistics amount needs a matched spending base, comparable volumes, service requirements, contractual access, and implementation dates. Employee savings belong only in the personnel calculation. Excluded feed, product, and physical gains stay excluded.
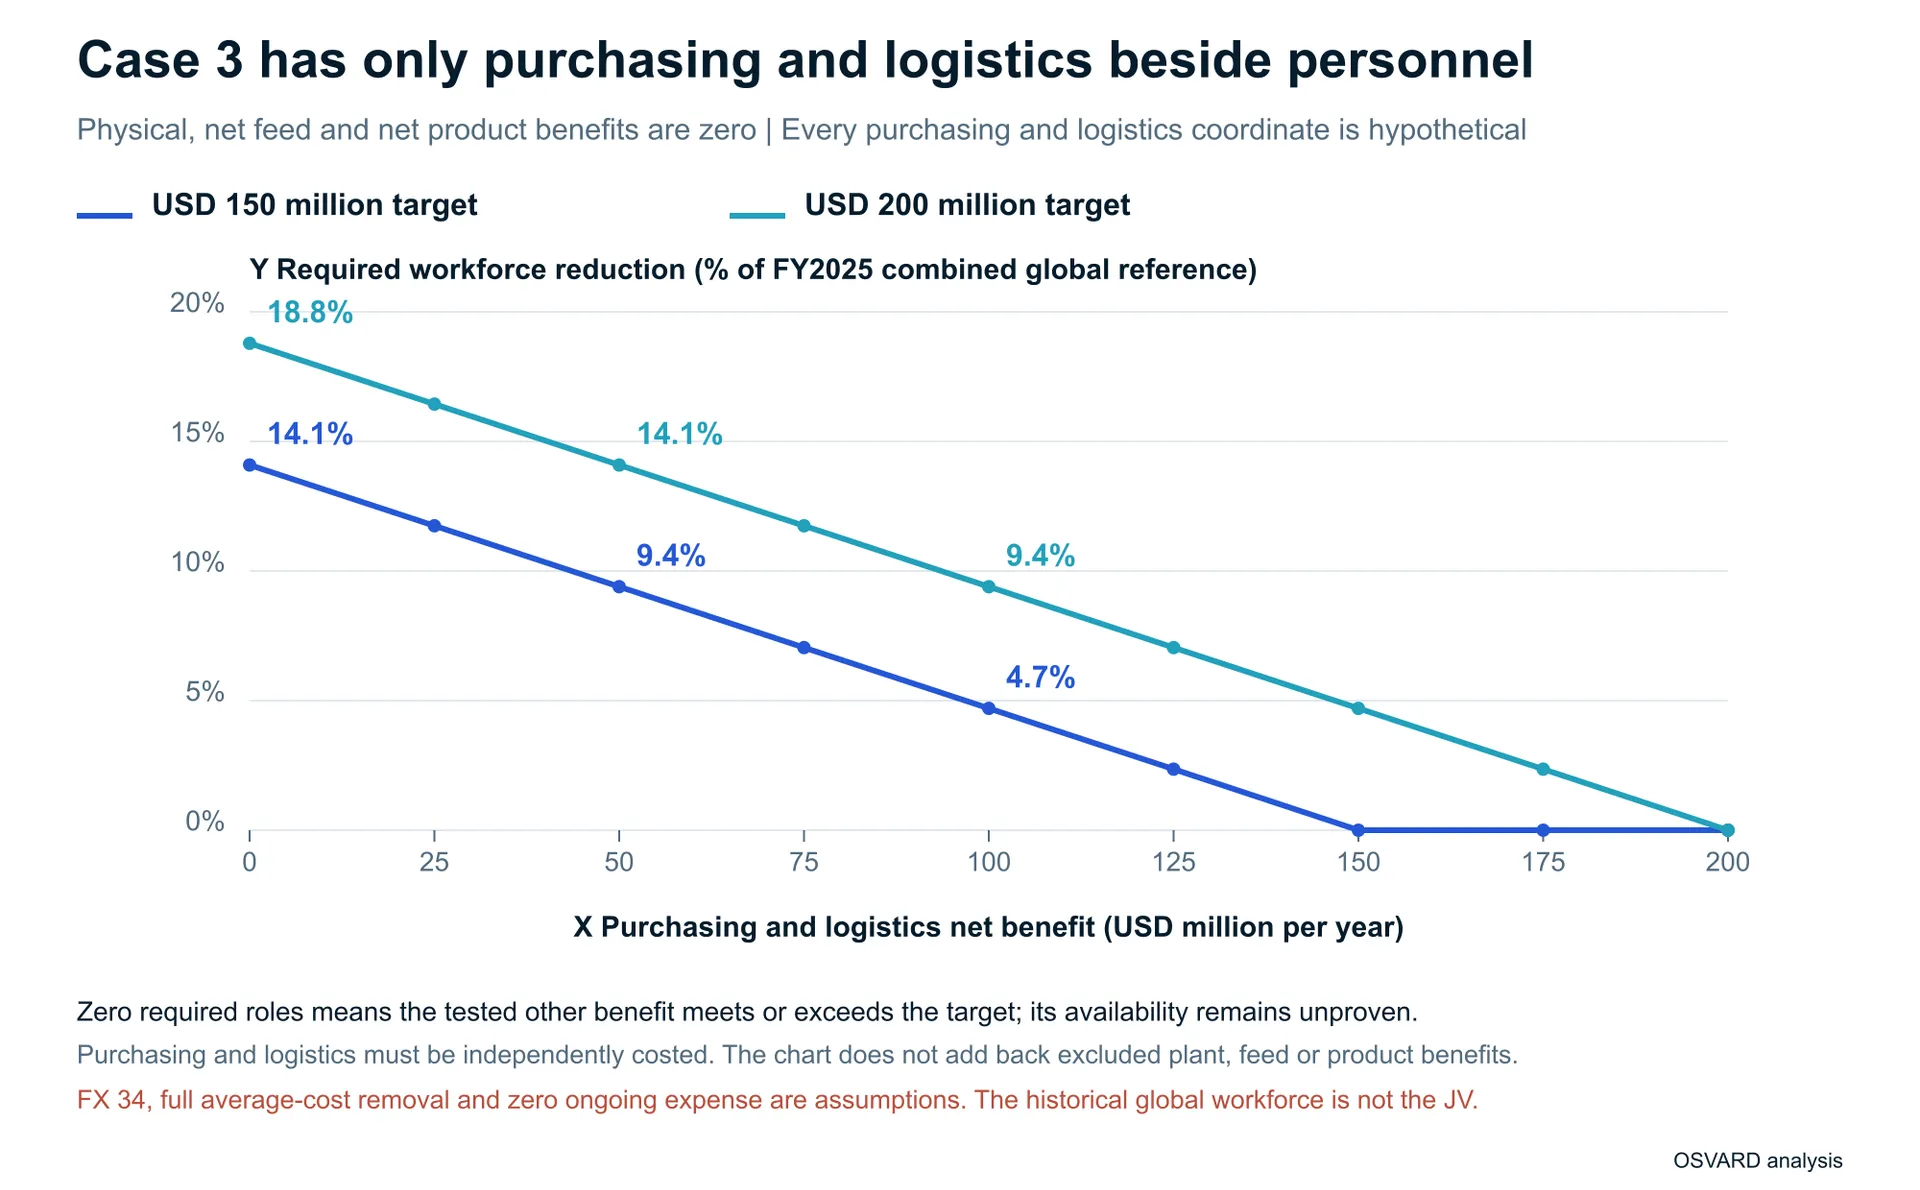
The Case 3 chart uses a single benefit axis because only one combined non-personnel channel remains. Moving along a line tests a different purchasing/logistics amount. The separation between the two lines shows the additional personnel burden created by increasing the annual target from USD 150 million to USD 200 million.
Case 3 has only purchasing and logistics beside personnel
 Open figure at full size (opens in a new tab)
Case 3 personnel requirement after purchasing and logistics
| Tested purchasing/logistics, USDm/year | Personnel requirement for USD 150m | Personnel requirement for USD 200m |
|---|---|---|
| 25 | USD 125m · 2,194 roles (11.7%) | USD 175m · 3,071 roles (16.4%) |
| 50 | USD 100m · 1,755 roles (9.4%) | USD 150m · 2,632 roles (14.1%) |
| 100 | USD 50m · 878 roles (4.7%) | USD 100m · 1,755 roles (9.4%) |
What the Case 3 tests require
At a tested USD 50 million purchasing/logistics contribution, the personnel requirement is USD 100 million for the lower target and USD 150 million for the higher target. Under the shared worldwide reference, those amounts require 1,755 and 2,632 roles respectively. The actual JV role requirement remains dependent on its eligible population and avoidable cost per role.
Case 4 uses personnel savings alone
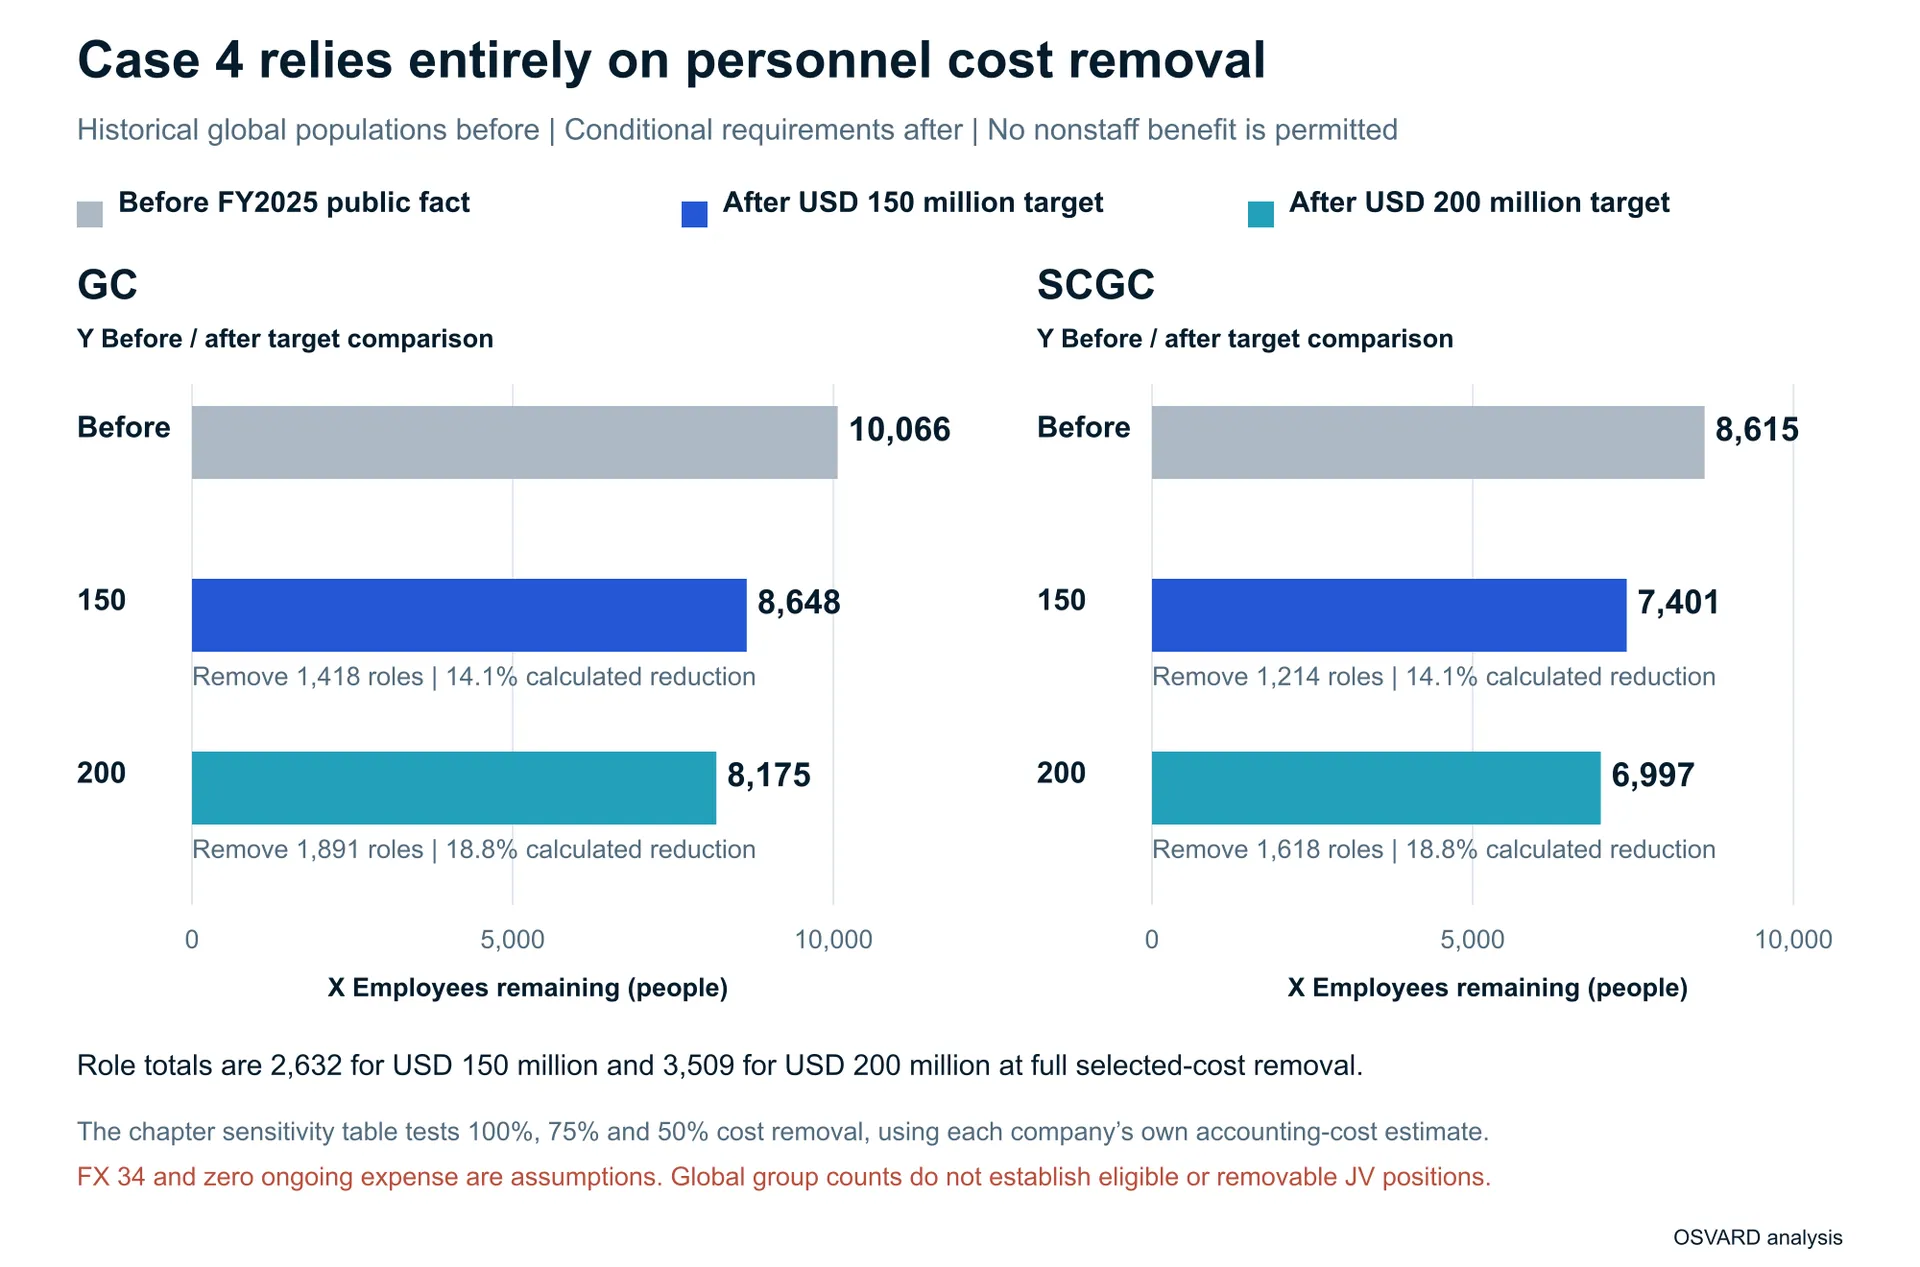
Case 4 excludes every non-personnel contribution. Purchasing, logistics, physical improvement, feed, and product benefits are all zero by the case definition. Personnel savings must therefore supply the full target plus recurring program expense. Its calculation therefore starts with the full annual target.
At the stated full-cost-removal and zero-expense assumptions, the USD 150 million target requires 1,418 GC roles and 1,214 SCGC roles. The USD 200 million target requires 1,891 and 1,618. The chart compares the reported worldwide populations before the hypothetical reductions with the calculated populations afterward. It does not show the actual workforce of the proposed venture.
Case 4 relies entirely on personnel cost removal
 Open figure at full size (opens in a new tab)
How removable cost changes the requirement
The proportion of cost that disappears has a large effect. A role may cease while overtime, contractors, replacement systems, or retained benefits absorb part of its average cost. The following sensitivity changes only that cost-removal proportion. The company split continues to use the same percentage-sharing rule and separate upward rounding.
Case 4 sensitivity to the share of average cost removed
| Annual target, USDm | Average cost removed | GC roles and global % | SCGC roles and global % | Total roles |
|---|---|---|---|---|
| 150 | 100% | 1,418 · 14.09% | 1,214 · 14.09% | 2,632 |
| 150 | 75% | 1,891 · 18.79% | 1,618 · 18.78% | 3,509 |
| 150 | 50% | 2,836 · 28.17% | 2,427 · 28.17% | 5,263 |
| 200 | 100% | 1,891 · 18.79% | 1,618 · 18.78% | 3,509 |
| 200 | 75% | 2,521 · 25.04% | 2,158 · 25.05% | 4,679 |
| 200 | 50% | 3,781 · 37.56% | 3,236 · 37.56% | 7,017 |
Interpreting the personnel sensitivity
The full-removal test requires approximately 14.1% or 18.8% of the historical global workforce. At 75% cost removal, total required roles rise to 3,509 or 4,679; at 50%, they rise to 5,263 or 7,017. These are workforce percentages, not reductions in total company operating cost. Numerical population limits do not establish that the required work can cease.
One worked example separates the four outcomes
An arithmetic example holds the tested starting amounts at 25 for physical improvement, 50 for purchasing/logistics, and 50 for net feed/product contribution. These are USD million per year, selected only to explain the case rules. They are not company forecasts, costed projects, or a recommended package. Recurring expense is zero in this example.
One example under four different conditions
| Case | Permitted non-personnel benefit | Personnel saving to reach 150 / 200 | Outcome against 150 / 200 |
|---|---|---|---|
| 1 | 125 | 0 / 0, excluded | Shortfall 25 / 75 |
| 2 | 100 | 0 / 0, excluded | Shortfall 50 / 100 |
| 3 | 50 | 100 / 150 required | At target if personnel requirement is delivered |
| 4 | 0 | 150 / 200 required | At target if personnel requirement is delivered |
What the worked example shows
Cases 1 and 2 retain their shortfalls because their conditions prohibit personnel savings. Cases 3 and 4 show the personnel savings that would be required to close the gap. Reporting that requirement is different from establishing that the associated work can be removed. The example makes the restrictions visible without forcing every tested combination to reach the target.
Reduction percentages need the right starting denominator
A cost-reduction percentage divides a saving by the matched expense before the change. A workforce-reduction percentage divides roles removed by the stated starting population. Feed and product contribution are margin gains, so they cannot be relabeled as operating-cost reductions. A single percentage across all four cases would hide these differences.
Where reductions or additional contribution must arise
| Case | Where cost reduction or contribution must arise | Personnel reduction |
|---|---|---|
| 1 | Physical and purchasing/logistics savings plus net feed/product contribution. Matched expense pools are needed for cost percentages. | 0% by case condition |
| 2 | Purchasing/logistics and net feed/product contribution. Further physical savings are zero. | 0% by case condition |
| 3 | Purchasing/logistics first; personnel covers the remainder. At tested purchasing/logistics of 50, personnel supplies 100 / 150. | 9.4% / 14.1% of the historical combined global reference |
| 4 | Personnel alone supplies 150 / 200, at full selected-cost removal and zero expense. | 14.1% / 18.8% of the historical combined global reference |
The spending base behind a five percent test
For example, a five-percent cost reduction supplying the entire target would require an eligible annual cost base of USD 3 billion for 150 or USD 4 billion for 200, with full capture and no recurring expense. Those are required bases, not disclosed controllable spending pools. The public cost-of-sales figures do not support assigning a uniform five-percent reduction to either contribution.
What the published figures allow in a before and after comparison
The final comparison returns to the financial starting point. The two FY2025 pro formas disclose revenues of THB 119,222 million and THB 131,814 million, with reported EBITDA of THB 5,619 million and negative THB 2,862 million, respectively. These remain separate contribution references. The filing does not supply a reconciled combined income statement after the merger, the elimination bridge, or an allocation of the synergy between the two businesses. GC transaction filing and financial references
The disclosed change that can be shown is the recurring synergy target itself. The filing pairs USD 150–200 million with potential recurring benefits of more than THB 5,100–6,800 million. The two target tests below use those disclosed currency pairs. They do not use a newly assumed exchange rate or convert the benefit into net profit. GC transaction filing and financial references
Before and after the annual synergy target
| Financial measure | Before synergy reference | After 150 target is achieved | After 200 target is achieved |
|---|---|---|---|
| Incremental annual merger benefit, USD million | 0 by comparison definition | 150 target benefit | 200 target benefit |
| Corresponding annual target amount, THB million | 0 by comparison definition | 5,100 target benchmark | 6,800 target benchmark |
| Total EBITDA and EBITDA margin | Separate FY2025 pro formas shown above | Not calculable from the published bridge | Not calculable from the published bridge |
| Net profit, free cash flow and leverage | No matched combined baseline established | Not calculated | Not calculated |
What reaching the target would change
Zero in the first two rows means no incremental merger benefit in the comparison. It does not mean either business has zero earnings. If the target is delivered, the recurring benefit increases by 150 or 200 million dollars a year relative to the comparable no-integration case. That is the supported target comparison. An after-integration EBITDA, tax charge, debt ratio, or profit allocation cannot be calculated reliably from the published information, so the study does not manufacture those results.
The likely route remains a business decision that needs a costed plan
OSVARD’s assessment is that personnel savings are easier to express as arithmetic than as an executable plan. The staff-only test requires about 14.1% or 18.8% of the historical global workforce at full selected-cost removal. Partial cost removal raises those percentages substantially. The data do not establish the eligible JV population, duplicated work, or replacement costs needed to call this the easiest or most likely route.
Cases 1 and 2 answer whether the target can be supported without reducing personnel; any unfilled amount stays visible. Case 3 shows the personnel burden after a purchasing/logistics contribution. Case 4 exposes the full personnel-only requirement. No public project breakdown currently allows the study to assign a probability to these routes or to claim that one will deliver the announced target.
A delivery decision needs independently costed projects, rights, and implementation dates. Engineering or systems investment, transition spending, employee-exit payments where applicable, and working-capital effects also matter. The workbook leaves the missing inputs unfilled and calculates NPV only when the required cash-flow assumptions are supplied. No company NPV or post-merger earnings forecast is presented from guessed inputs.
Reaching the announced synergy target would add the stated recurring benefit relative to a comparable standalone outcome. The four cases show what each route would have to supply. They do not yet establish the combined company’s resulting profit or the operating feasibility of the required changes. That judgment becomes possible when the project and contribution-level information supports it.