
How We Check Thailand's GDP Against IMF Figures
We looked at Thailand's GDP figures around the time of the IMF and World Bank meetings in Bangkok. Here's how the published figures stack up against each other, where they differ, and what we can learn from the comparison.

The short version
- The official spending numbers add up to NESDC's published 2025 GDP figure. That's approximately 0.01% below the IMF's historical figure.
- In baht at current prices, the two forecasts for Thailand's 2026 GDP are roughly 0.30% apart. If you take the IMF's growth and price assumptions and apply them to the Thai starting point, the gap almost disappears.
- Check the period, the prices, the release date, and the assumptions before you pick a GDP figure. Agreement between the calculations doesn't guarantee that the forecast will come true.
Why we checked the figures
The 2026 Annual Meetings of the International Monetary Fund (IMF) and the World Bank Group were held in Bangkok from 12 to 18 October. Thailand last hosted the meetings in 1991. This gathering of policymakers and development partners prompted us to reexamine the numbers used to describe the Thai economy.
Discussion of the economy often comes down to growth rates, the size of the economy, and the level of debt. The numbers we're looking at may be for different years or based on different prices. One may also be more recent than another. We wanted to put the Thai and IMF numbers on the same basis before trying to make sense of the gap between them.
At OSVARD, we used the published data from Thailand's National Economic and Social Development Council (NESDC), the IMF, the Bank of Thailand (BOT), and the Public Debt Management Office (PDMO). We started with spending data that we could add up, then moved to the 2026 forecasts. Debt ratios gave us another check on the GDP numbers.
We closed this review on 14 October 2026, during the meetings. Below, you'll find links to the official figures and the steps in our calculations. You can follow those steps to check our answers.
Choosing figures that can be compared
GDP measures the value of goods and services produced in an economy. If we value that production at current prices, we have nominal GDP. It can change for several reasons. The economy may be producing more or less, prices may have changed, or both. Real GDP removes the price effect so we can compare production across time.
We'll work in Thai baht and use nominal GDP for each calendar year. A report of 2% real growth isn't enough to tell us how much the baht total has changed. Throughout this article, one trillion baht means 1,000 billion baht. We do the arithmetic with the full published figures, then round what you see to no more than two decimal places. Where a source reports a debt ratio to one decimal place, we keep it that way.
The 2025 figures look back at activity that has happened, though they can still be revised. In the Thai accounts, the p1 label tells us that NESDC compiled the annual total from quarterly accounts rather than producing a separate annual figure. The IMF likewise refers to 2025 as its most recent actual year. The forecasts for 2026 look forward to a full-year result that isn't yet available. We keep these different kinds of figures labeled throughout.
With a debt ratio, there's another detail to check. The GDP figure may cover the previous four quarters, which don't necessarily run from January to December. We'll check that period when we get to the debt data below.
Rebuilding the total from the accounts
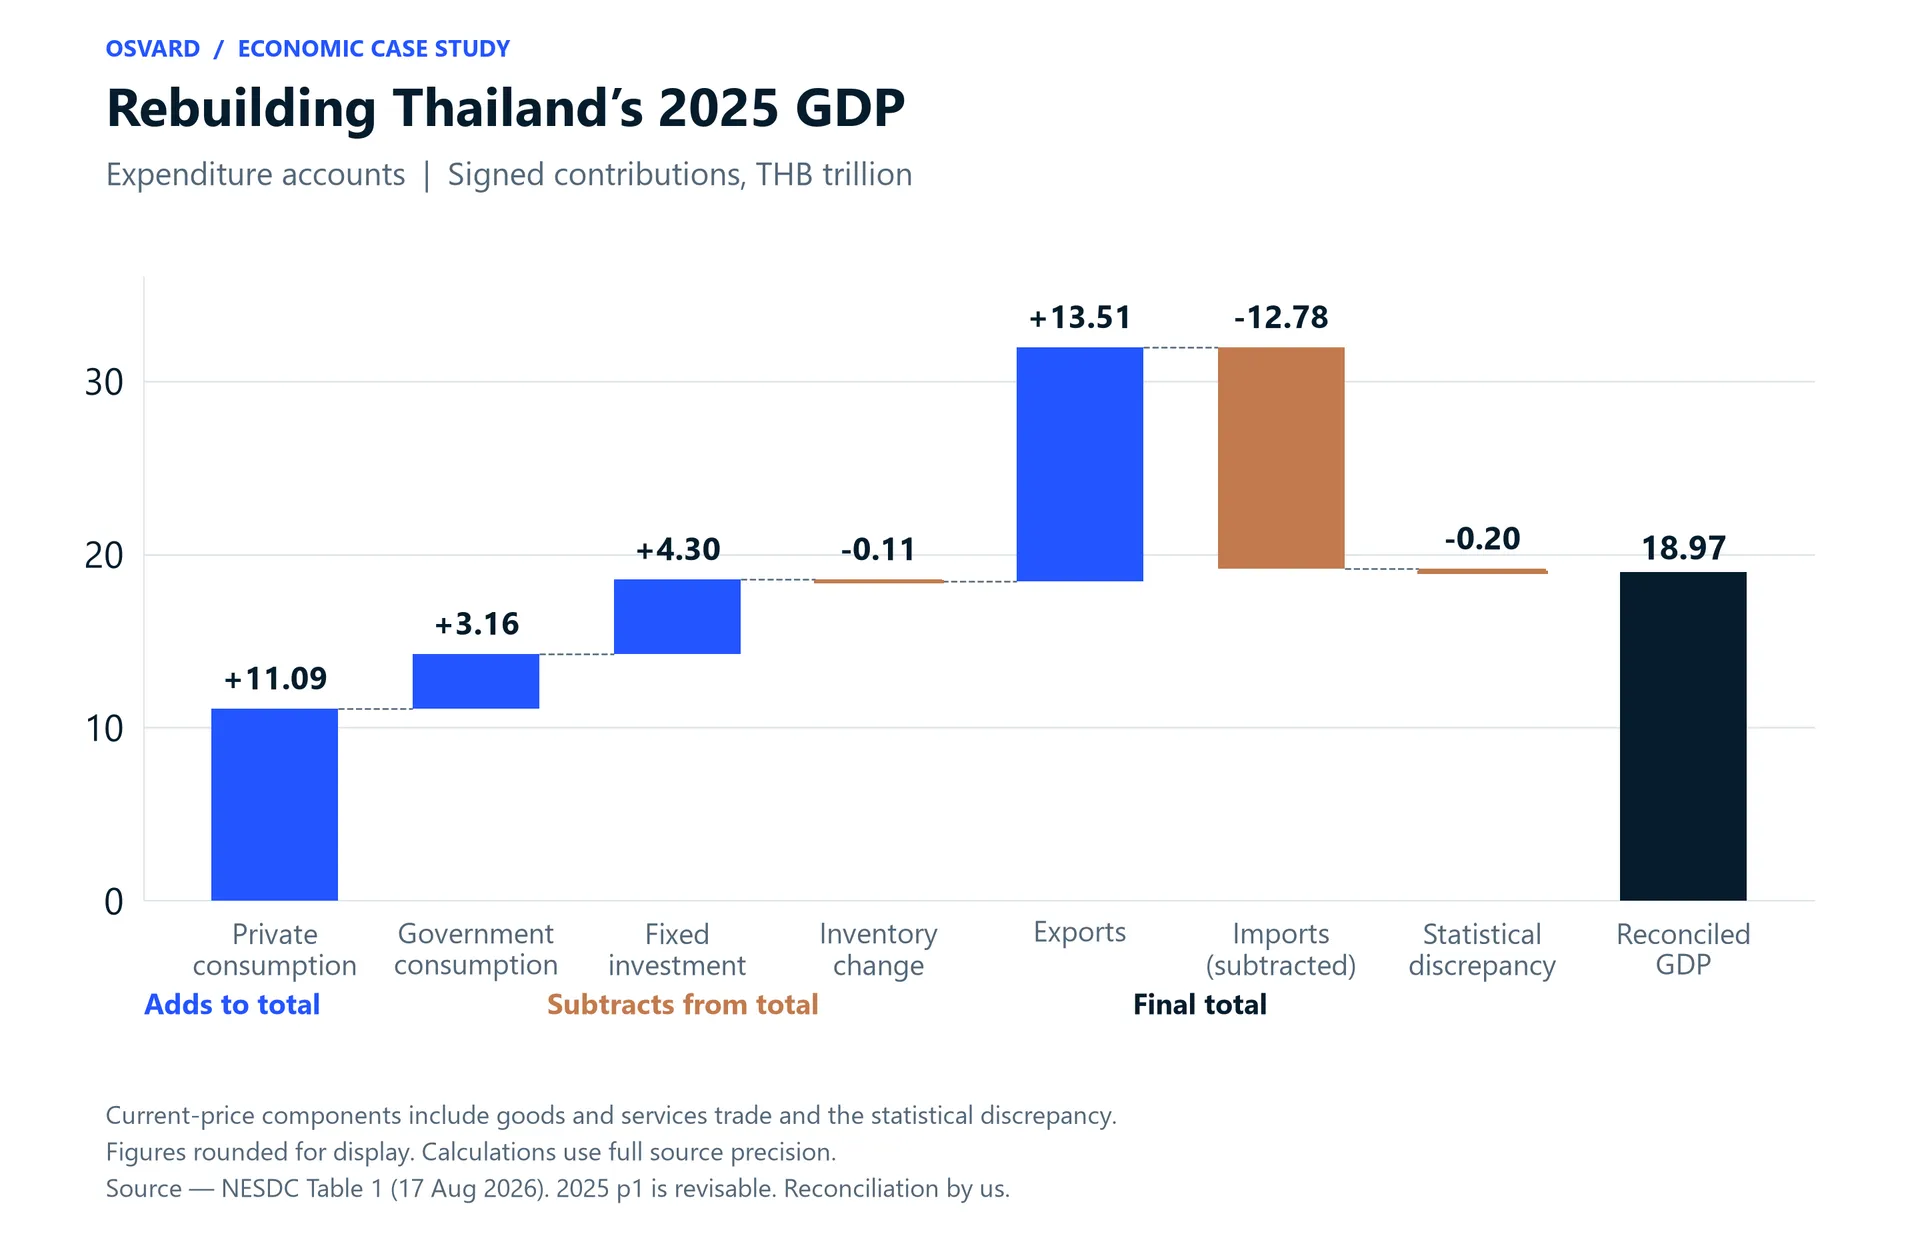
The 2025 accounts gave us a starting point. In NESDC's expenditure data, we had private consumption, government consumption, fixed investment, changes in inventories, exports, and imports. We added the spending components, kept the sign on the inventory change, and subtracted imports. Some of the spending was on goods and services produced abroad, which is why imports come out of the total.
Our first sum was THB 19.17 trillion. The accounts also include an adjustment called the statistical discrepancy. It reconciles the national-accounts estimates. Until we include it, we have only a subtotal.
With the plus and minus signs kept on all seven components, our total matches NESDC's exactly before display rounding. It is THB 18.97 trillion when rounded. We've checked that the components add up and that we can work backward through the calculation to the source. We haven't conducted another survey or measured Thailand's GDP independently.
We need current prices for this addition. The inflation-adjusted components use a different method of price adjustment and may not add up to the headline real GDP figure.
How Thailand’s 2025 GDP is reconstructed
| Component | Signed contribution, THB billion | How it enters GDP |
|---|---|---|
| Private final consumption | 11,091.58 | Added |
| Government final consumption | 3,159.71 | Added |
| Fixed investment | 4,300.12 | Added |
| Change in inventories | −112.33 | Signed change |
| Exports of goods and services | 13,508.87 | Added |
| Imports of goods and services | −12,777.04 | Subtracted |
| Subtotal before discrepancy | 19,170.90 | Our calculation |
| Statistical discrepancy | −199.17 | Published reconciliation adjustment |
| Reconciled GDP | 18,971.74 | THB 18.97 trillion when rounded |
Adding up the 2025 accounts
 Open figure at full size (opens in a new tab)
Putting the historical totals side by side
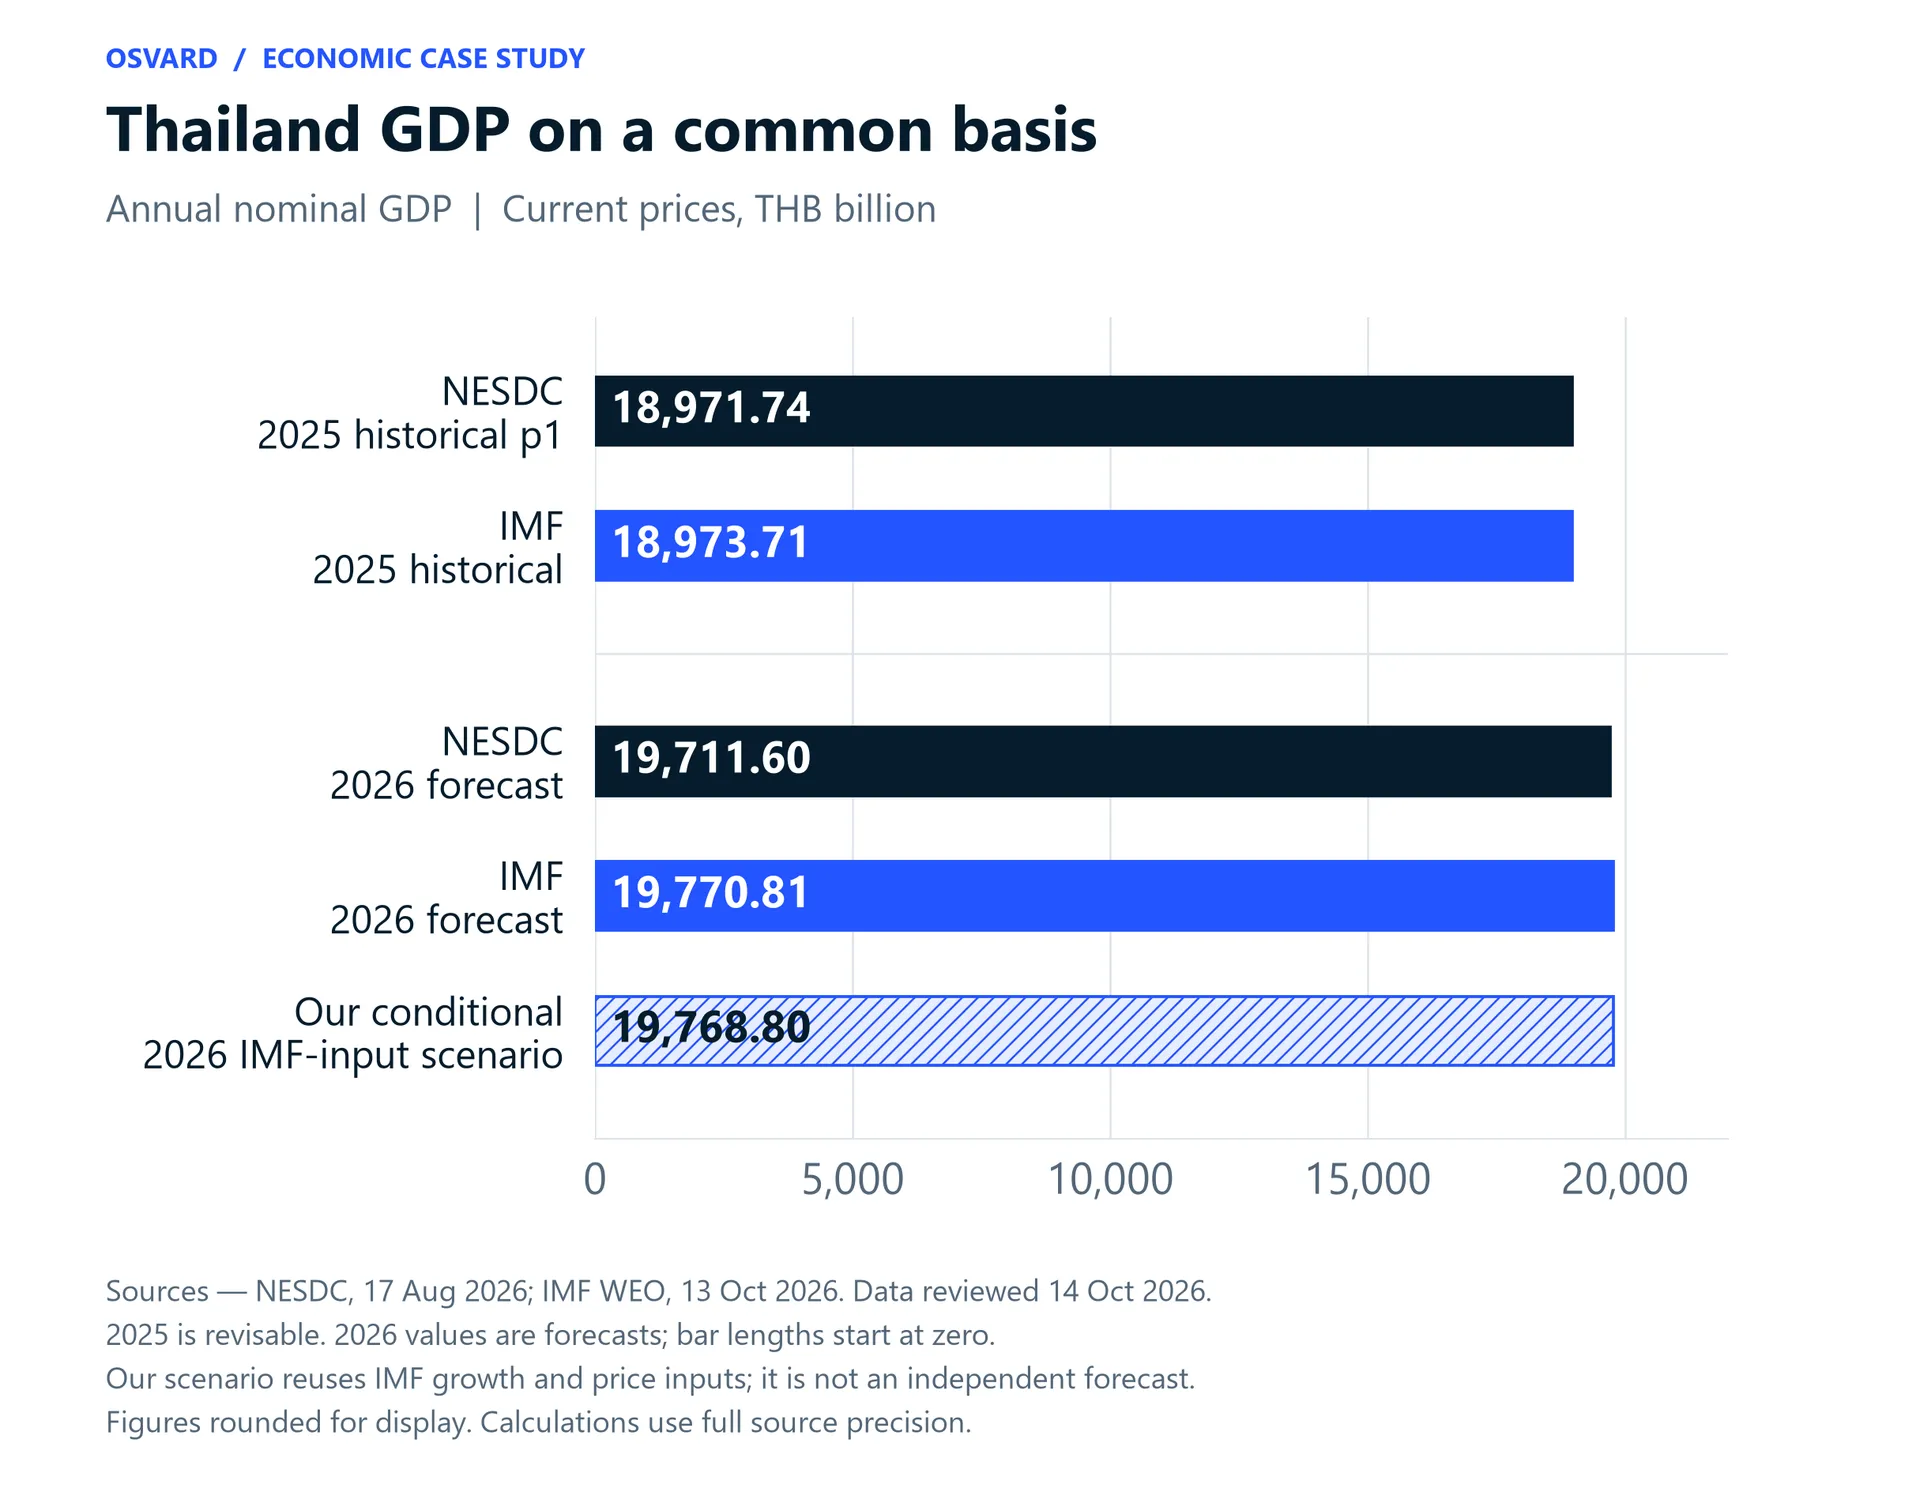
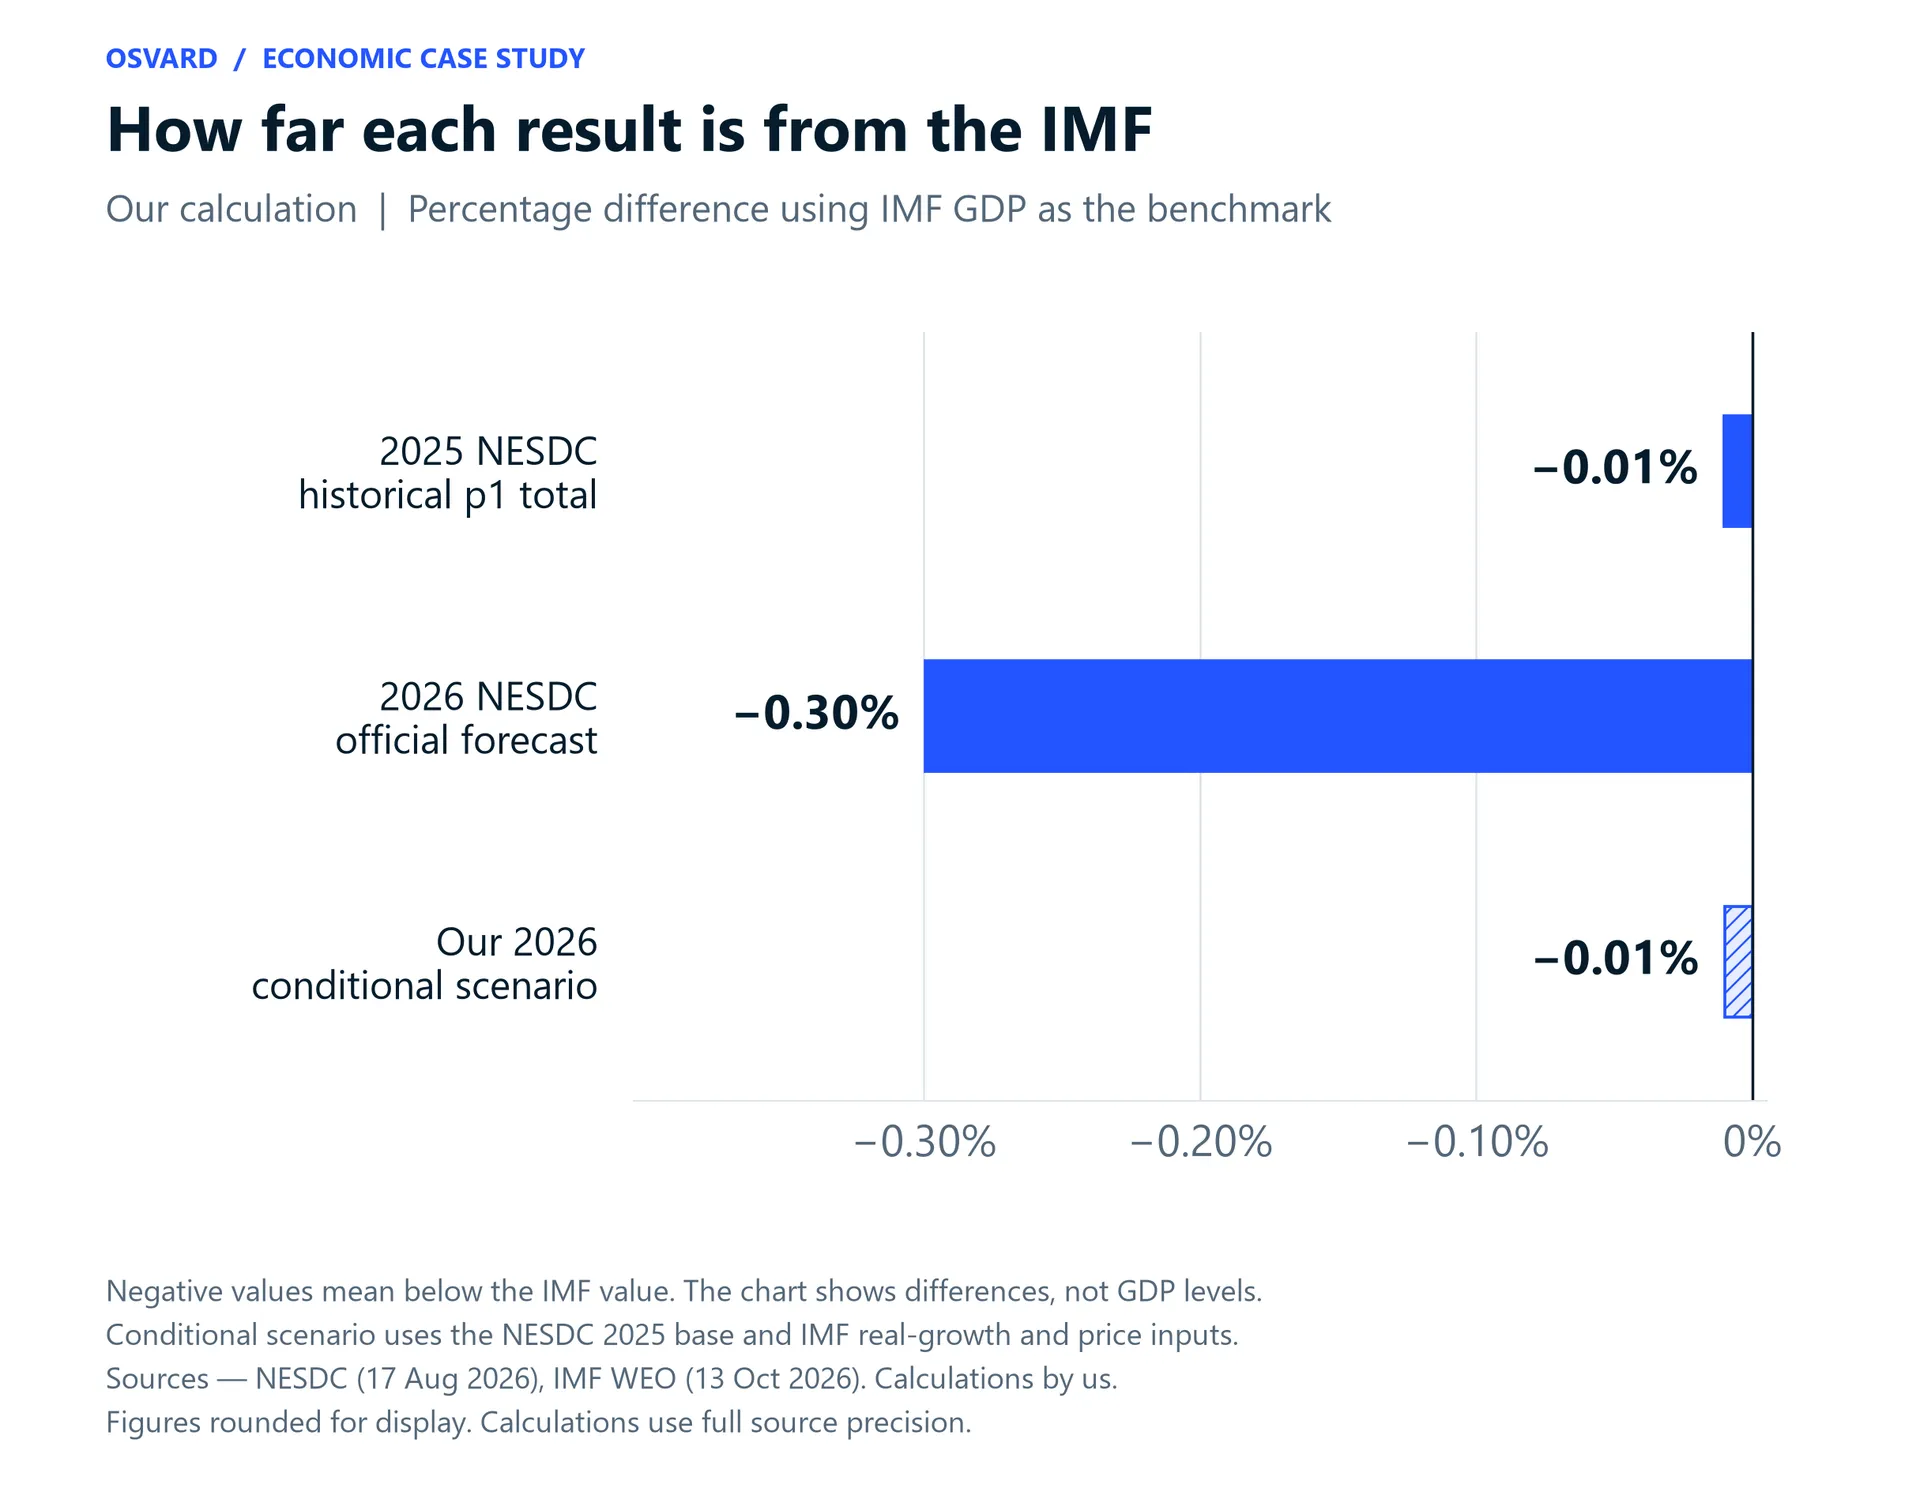
The IMF's October 2026 World Economic Outlook (WEO) has nominal GDP at THB 18,973.71 billion for 2025. Our total from the Thai accounts is THB 1.97 billion lower. That's just 0.01% of the IMF figure. Going back to 2024, we found an exact match at THB 18,683.89 billion.
For 2025, we have a very small gap in an economy worth roughly THB 19 trillion. The year, currency, and price basis now match, and the figures are close. The sources don't explain the remaining difference. Publication timing, revisions or updates can affect a comparison like this, but we can't identify any of them as the reason for this particular gap.
Rounded to one decimal place, the two estimates of real growth in 2025 both read 2.4%. Using NESDC's data gives 2.44%; the IMF gives 2.41%. The difference is 0.03 percentage points. NESDC's GDP in baht at current prices grew by about 1.54%, which is the nominal growth rate.
The GDP value in baht and the volume of activity can grow at different rates. Nominal growth describes the change in that baht value; real growth describes the change in the volume of activity. They aren't interchangeable, and we show both.
Looking ahead to the 2026 result
NESDC's outlook issued on 17 August 2026 puts nominal GDP at THB 19,711.60 billion. The next figure we checked was the IMF's THB 19,770.81 billion, from the WEO released on 13 October. The Thai forecast is THB 59.21 billion lower, a difference of 0.30% against the IMF value.
NESDC puts real growth in the 2.0% to 2.5% range. It also publishes a point estimate of 2.2%, which is the figure we use. Calculating the midpoint of the range would give a different number, not the 2.2% NESDC states. The IMF has 2.1%, within the Thai range.
The Thai outlook combines slightly stronger real growth with a lower GDP value in baht. To understand that combination, we also need the starting GDP figure and the expected change in prices. NESDC expects GDP-wide prices to rise by 1.5% to 2.0%. Our calculation from the IMF price indexes gives a rise of about 2.06%.
There's roughly an eight-week gap between the releases, so the forecasters were working with different information. We don't yet have a full annual result for 2026 against which to judge either forecast. The price assumptions help us read the nominal and real figures together, but the documents don't establish the precise reason for the entire forecast gap.
Thailand GDP on a common annual basis
| Calendar year and status | NESDC, THB billion | IMF October 2026, THB billion | NESDC minus IMF, % |
|---|---|---|---|
| 2024 historical | 18,683.89 | 18,683.89 | 0.00% |
| 2025 historical, revisable | 18,971.74 | 18,973.71 | −0.01% |
| 2026 full-year forecast | 19,711.60 | 19,770.81 | −0.30% |
Thailand GDP on a common basis
 Open figure at full size (opens in a new tab)
Calculating the effect of prices and currency
The price index we need is called the GDP deflator. It covers the goods and services that go into GDP and converts real output into its value in baht at current prices. That's the measure the IMF uses. Consumer price inflation covers a different set of prices, so we can't simply substitute it here.
Here's the 2026 calculation. Start with the IMF's real GDP of THB 11,768.06 billion at its reference prices. Multiply by its GDP deflator index of 168.00, then divide by 100. We used the full published values for those steps. Our answer comes out about THB 3.20 million above the IMF's nominal total, a gap consistent with the precision of the inputs. On the page, both round to THB 19,770.81 billion.
Real output up by 2.1% and GDP-wide prices up by about 2.06% give nominal growth of about 4.20%. It's tempting just to add the two growth rates together. That's close, but the precise answer also accounts for the way the output and price changes multiply together.
We can also check the conversion to dollars. The IMF's 2026 GDP figure is USD 599.12 billion. Take its baht GDP and divide it by its dollar GDP, and you get an implied rate of about THB 33 per US dollar. We calculated that rate ourselves from the two series. It isn't a directly published WEO exchange-rate forecast or an observed rate for a completed year.
The Thai outlook puts GDP at USD 597.3 billion, with an exchange-rate range of THB 32.5 to 33.5 per dollar. The midpoint is 33.0. These are market-dollar amounts. Purchasing-power-parity GDP uses a different conversion method to compare purchasing power across countries, so we keep it separate.
One more calculation with the same assumptions
We'd checked the historical totals and compared the forecasts. Both pairs were close. We then took NESDC's 2025 GDP as our starting figure and applied the IMF's growth and price assumptions for 2026. That gave us the result of using the same assumptions with a different base.
We began with NESDC's GDP of THB 18,971.74 billion, allowed for real output growth of 2.1%, and applied the change in the IMF GDP deflator from 164.62 to 168.00. In other words, we increased the starting GDP by the real growth rate, then multiplied by the ratio of the new price index to the previous one. Using the full published figures, rather than these rounded display values, gives THB 19,768.80 billion.
Put this result beside the IMF's 2026 projection and the gap is THB 2.01 billion, or 0.01%, with our calculation lower. Matching the growth and price assumptions has brought the two amounts very close. The small amount left reflects the different starting GDP figure and the precision of the published series.
This is a conditional scenario using IMF inputs that we've borrowed. We haven't made an independent forecast. Our arithmetic takes those inputs and produces a result. It doesn't establish that the assumptions will hold or that final GDP will reach the amount we've calculated.
The starting value and the inputs are all visible. If you want to try a different assumption, you can put it into the calculation and see what changes.
How far each result is from the IMF
 Open figure at full size (opens in a new tab)
The February forecast is not the October forecast
An earlier IMF figure would give us a different comparison. Its press release on Thailand's Article IV consultation, published on 13 February 2026, gave a 2026 real-growth forecast of 1.6% and nominal GDP of THB 19,341.20 billion. The October WEO had 2.1% and THB 19,770.81 billion, respectively. The real-growth forecast had been revised up by 0.5 percentage points.
These are different releases, sometimes called forecast vintages. Each was prepared with the information available at the time. Put the earlier IMF figure alongside a later Thai forecast and the timing difference can get lost. For this comparison, we've used the October WEO and kept the NESDC August release date alongside its figures.
The October WEO database appendix helps us date the information behind the forecast. It gives 30 September 2026 as the general cutoff, but Thailand's rows were updated on 25 September. For the exchange-rate basis, the relevant dates are earlier still, 31 July to 28 August. Country teams use national information and their own analysis, along with shared global assumptions and established policies. None of these dates tells us what happened after the forecast was prepared.
One field we would have liked to read, Thailand's projection basis, is blank in the public data. The material doesn't explain every modeling choice either. You can repeat the accounting calculations with the published figures. You can't reconstruct the country team's full model and judgments from the evidence we have for this review.
Finding the GDP figure inside a debt ratio
There's a straightforward check we can do with a debt figure and its debt-to-GDP ratio. Write the percentage as a decimal, then divide the debt by it. That gives you the GDP denominator implied by the ratio. If the percentage has been rounded, the answer can only approximate the GDP originally used.
The BOT household-debt data put Q4 2025 debt at THB 16,470.41 billion and 86.8% of GDP. Working back from the full published debt amount and that reported percentage gives implied GDP of THB 18,975.12 billion. It is about 0.02% above NESDC's annual total. The ratio was published to one decimal place, so the small gap is consistent with rounding.
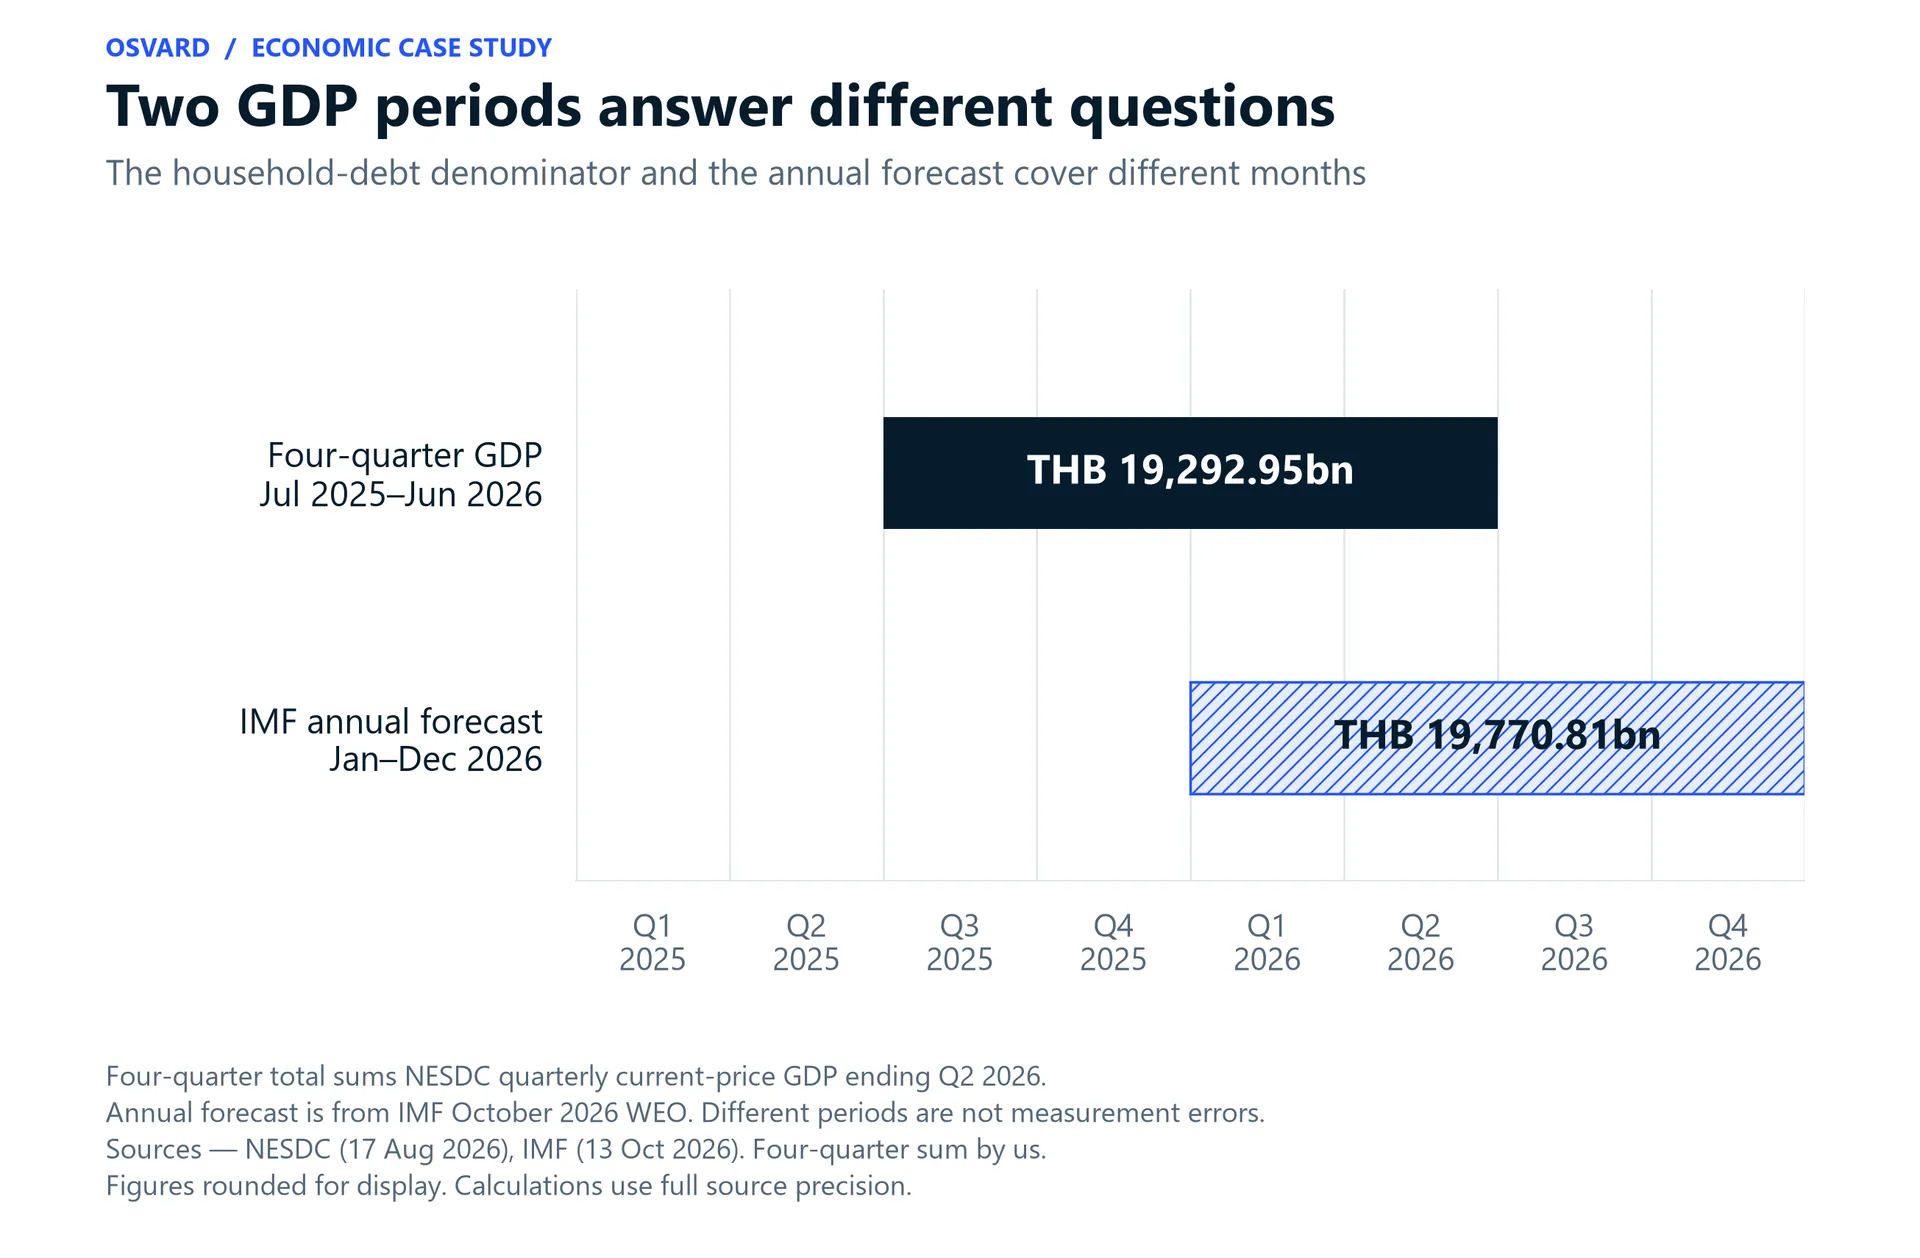
The GDP behind BOT's Q2 2026 debt ratio covers July 2025 through June 2026, the preceding four quarters. We added the NESDC figures for those quarters so we could compare the same period. The table below shows that sum beside the GDP implied by the debt amount and reported ratio. Their roughly 0.03% gap is consistent with rounding.
The July-to-June total and the IMF's January-to-December 2026 forecast cover different twelve-month periods. A difference between them wouldn't prove the forecast wrong. The reported ratio of 85.2% is also rounded. Taking that rounding into account gives an implied GDP range of about THB 19,275.26 to 19,297.89 billion. Our sum of the quarters is within that range.
We ran into a limit with PDMO's end-August 2026 summary. The full debt amount and reported ratio let us work out an implied GDP denominator, which we've put in the table. We couldn't find the months that GDP covered in the summary, so we can't call the answer a new full-year GDP figure.
A debt ratio lets us check whether the figures fit together when we know the GDP period. It doesn't give us a new measurement of GDP. We also keep household debt and public debt separate because their definitions differ.
Reading the GDP figures implied by debt ratios
| Debt series and period | Debt, ratio and implied GDP | How to read the result |
|---|---|---|
| Household debt, Q4 2025 | Debt THB 16,470.41bn; ratio 86.8%; implied GDP THB 18,975.12bn | The four quarters end in Q4 2025. The small gap from annual GDP fits within the rounding of the ratio. |
| Household debt, Q2 2026 | Debt THB 16,432.16bn; ratio 85.2%; implied GDP THB 19,286.57bn | Four quarters ending Q2 2026; compare with THB 19,292.95bn for July 2025–June 2026 |
| Public debt, end-August 2026 | Debt THB 13,191.84bn; ratio 67.94%; implied GDP THB 19,416.89bn | The reviewed summary does not establish the exact GDP period. Treat this as an implied denominator. |
Check the months behind each GDP figure
 Open figure at full size (opens in a new tab)
Before using a GDP figure in a business plan
The spending figures add up to the official Thai historical total. The Thai and IMF forecasts are close too. When we reuse the IMF growth and GDP-wide price assumptions, our conditional result comes almost into line with its forecast. The debt calculations show why the dates matter. Two totals covering different twelve-month periods shouldn't be compared as though they covered the same year.
Suppose a GDP figure is going into a business plan, a project review or a financial discussion. Put the source and the calculation alongside it. Be clear about whether it's a reported outcome or based on an assumption about the future. Then the person reading the assessment can check the work and repeat it.
We still can't explain the precise cause of the small 2025 residual. We can't reconstruct the IMF's full forecasting model from the reviewed sources, and PDMO's August summary doesn't confirm the GDP reference period. Historical figures can be revised, and forecasts can change. No GDP figure by itself tells us how much growth a particular policy caused.
The Bangkok meetings are over. These figures are still useful as a worked example of checking an economic headline. They're close, provided we keep their periods, prices, release dates, and assumptions in mind when using them.