
Thailand GDP and the IMF: How We Check the Numbers
As the IMF and World Bank meet in Bangkok, we follow Thailand’s GDP figures from the original data to the forecasts and explain what the comparisons can tell us.
The short version
- We rebuilt Thailand’s 2025 GDP from official spending data. The total matches NESDC’s figure and is about 0.0104% below the IMF’s historical value.
- The NESDC and IMF forecasts for Thailand’s 2026 GDP, measured in baht at current prices, differ by about 0.30%. When we apply the same IMF growth and price assumptions to the Thai starting figure, the results nearly coincide.
- Before comparing economic figures, we check their periods, prices, publication dates and assumptions. A close match between calculations does not tell us whether a forecast will come true.
A meeting in Bangkok, and a question behind the headlines
This week, Bangkok is hosting the 2026 Annual Meetings of the International Monetary Fund (IMF) and World Bank Group, from 12 to 18 October. Thailand last hosted these meetings in 1991. With policymakers and development partners gathering in the capital, Thailand’s economic outlook is a natural part of the conversation.
That conversation quickly leads to numbers: how fast the economy is growing, how much it is worth, and how much debt it carries. Yet two GDP figures can look different simply because they describe different years, use different prices or were prepared at different times. Before asking which number to use, it helps to ask what each one means.
At OSVARD, we approached this case study with that question in mind. We followed the published evidence from Thailand’s National Economic and Social Development Council (NESDC), the IMF, the Bank of Thailand (BOT) and the Public Debt Management Office (PDMO). We started by rebuilding a historical GDP total, then compared the outlook for 2026, and finally checked the GDP figures implied by debt ratios.
The steps below show how we can assess economic evidence in a way that another reader can follow. We credit each official source and identify our calculations separately. Our evidence review was completed on 14 October 2026.
Before comparing, we put the numbers on the same page
Our first step was to agree on what we were comparing. GDP is the value of goods and services produced within an economy. Its current-price value, called nominal GDP, changes when production changes and when prices change. Real GDP removes the effect of changing prices, helping us see whether the economy is producing more or less.
This distinction matters in practice. Real growth of 2% does not necessarily mean the economy’s value in baht rises by 2%. To compare the headline GDP totals fairly, we use calendar-year nominal GDP in Thai baht throughout the main analysis. One trillion baht equals 1,000 billion baht. We round figures in the explanation when that helps readability and keep more precision in the tables.
We also separate what has happened from what is expected. The 2025 figures describe historical activity, although they can still be revised. NESDC labels its annual total p1: it is built from the quarterly accounts rather than a separately compiled annual figure. The IMF identifies 2025 as its latest actual year. The figures for 2026 are forecasts for the full year, not completed annual results.
A figure worked backward from a debt ratio needs another label. Its GDP period may cover the preceding four quarters rather than January to December. We return to that distinction later, because it changes what a comparison can tell us.
We start with a total we can rebuild
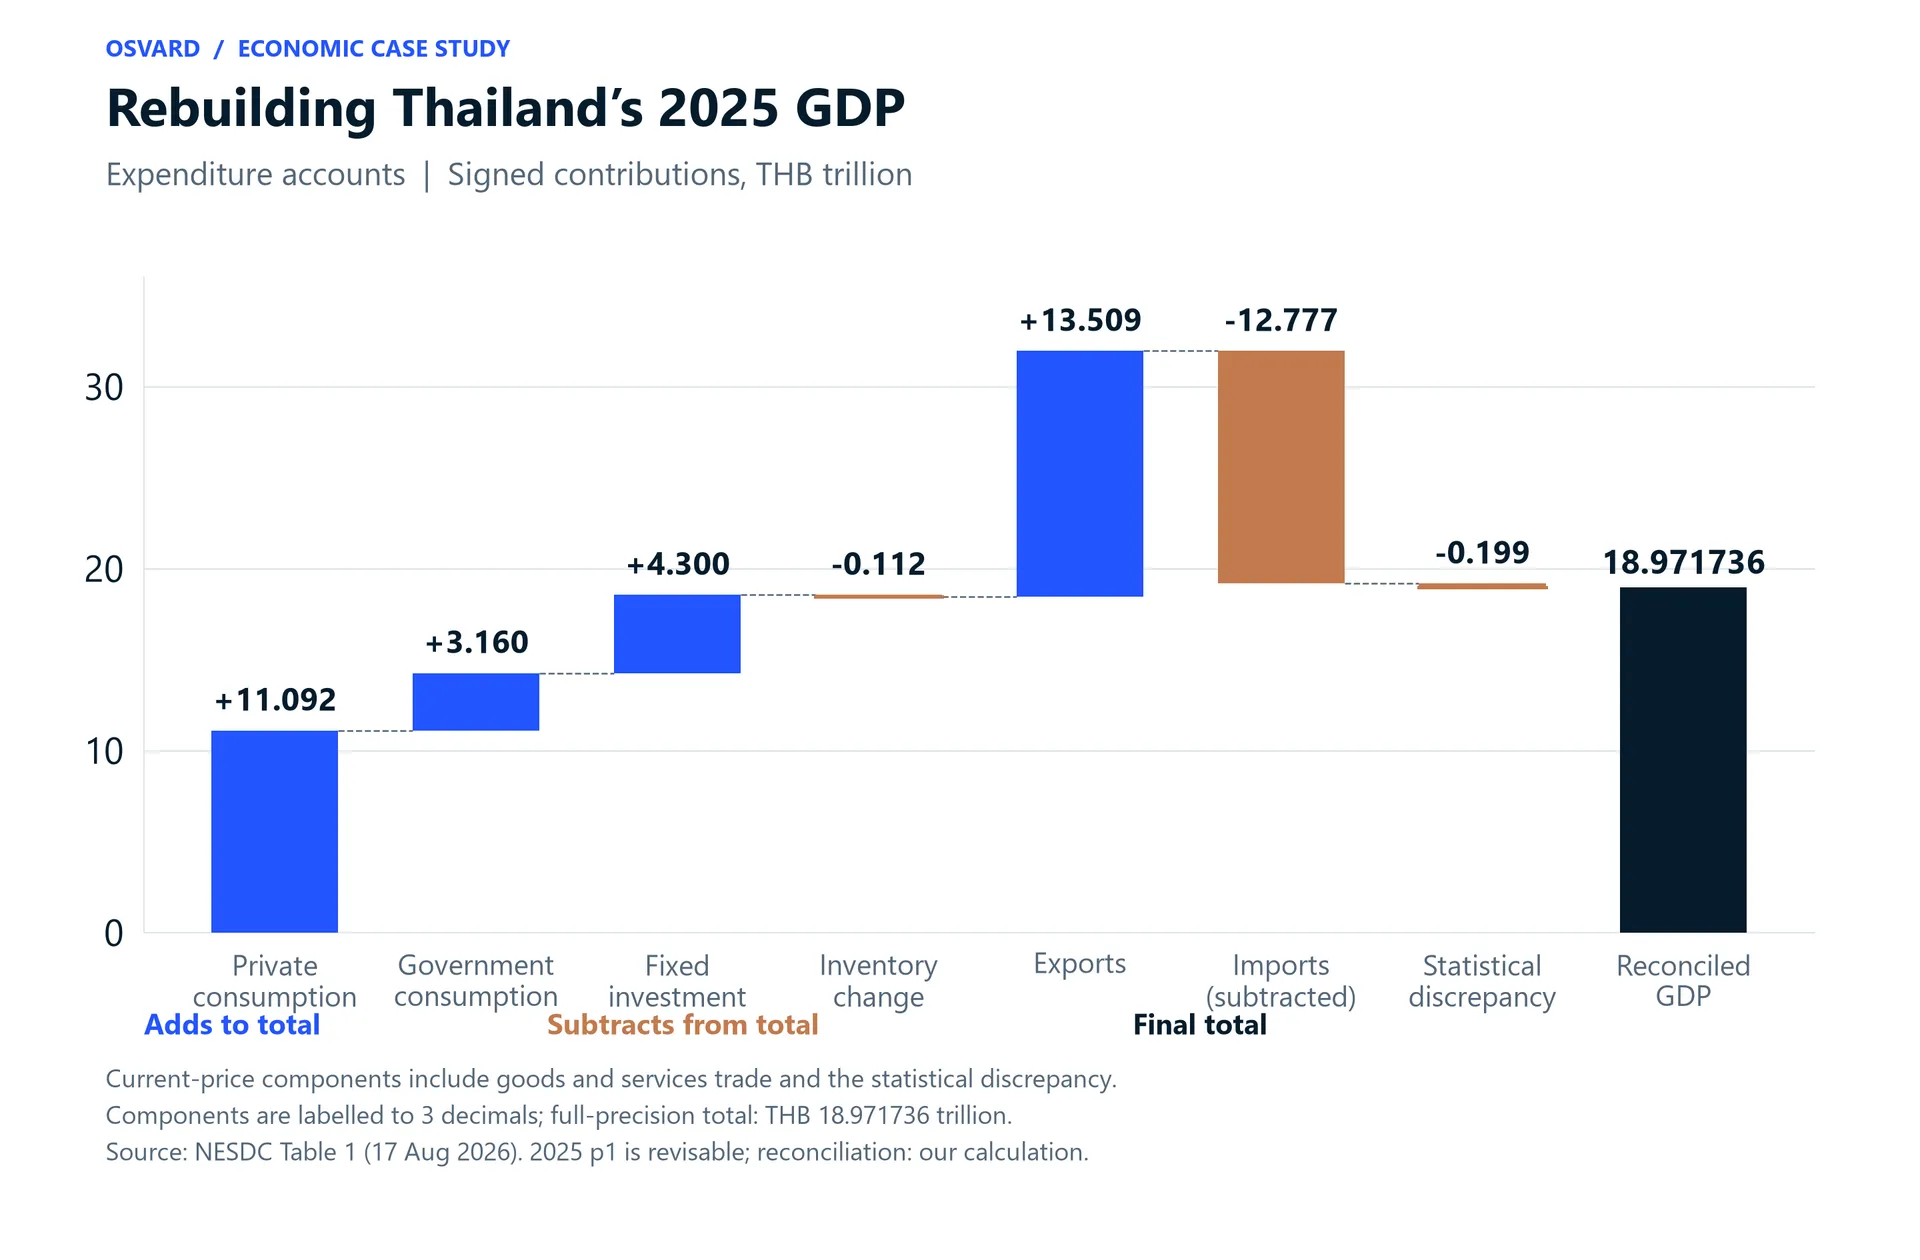
Rather than starting with a forecast, we began with Thailand’s published 2025 accounts. NESDC’s expenditure data let us rebuild GDP from spending: private consumption, government consumption, fixed investment, changes in inventories and exports, with imports subtracted. Imports are taken out because some spending buys goods and services produced outside Thailand.
Adding those figures gives THB 19.170904 trillion. But the accounting story is not finished there. NESDC also publishes a statistical discrepancy, a reconciliation adjustment between national-accounts estimates. We need to include it to reach the official total.
With all seven signed components included, our calculation gives THB 18.971736 trillion. That matches NESDC’s published GDP exactly. The useful result is straightforward: we can trace the total back to its published components and reproduce the arithmetic. We have not conducted a new economic survey or independently measured Thailand’s GDP.
We use current-price values for this step. Inflation-adjusted components follow a different price-adjustment method, so adding them may not reproduce the headline real GDP total.
How Thailand’s 2025 GDP is reconstructed
| Component | Signed contribution, THB billion | How it enters GDP |
|---|---|---|
| Private final consumption | 11,091.576 | Added |
| Government final consumption | 3,159.711 | Added |
| Fixed investment | 4,300.120 | Added |
| Change in inventories | −112.329 | Signed change |
| Exports of goods and services | 13,508.867 | Added |
| Imports of goods and services | −12,777.041 | Subtracted |
| Subtotal before discrepancy | 19,170.904 | Our calculation |
| Statistical discrepancy | −199.168 | Published reconciliation adjustment |
| Reconciled GDP | 18,971.736 | Equals THB 18.971736 trillion |
Rebuilding Thailand's 2025 GDP
 Open figure at full size (opens in a new tab)
Then we ask whether the IMF tells the same historical story
Once we had rebuilt the Thai total, we could compare it with the IMF’s October 2026 World Economic Outlook (WEO). The IMF reports 2025 nominal GDP of THB 18.973709 trillion. Our reconstructed NESDC total is THB 1.973 billion lower, a difference of just 0.0104% of the IMF value. The reviewed 2024 figures match exactly, at THB 18.683888 trillion.
For an economy worth roughly THB 19 trillion, the 2025 gap is small. It supports a close reconciliation once the year, currency and price basis match. It does not explain why the last small difference remains. Publication timing, revisions and data updates can affect a comparison, but the available sources do not establish which factor caused this particular gap.
Growth adds another part of the story. NESDC’s current-price GDP rose by about 1.54% in 2025, while its real GDP grew by 2.4413%. The IMF reports real growth of 2.408%. Both real-growth figures round to 2.4% at one decimal place; at greater precision, they differ by 0.0333 percentage points.
There is no contradiction in reporting different nominal and real growth rates. They answer different questions: how the baht value changed, and how the volume of activity changed. We keep both measures visible rather than treating one as a substitute for the other.
What the 2026 forecasts tell us
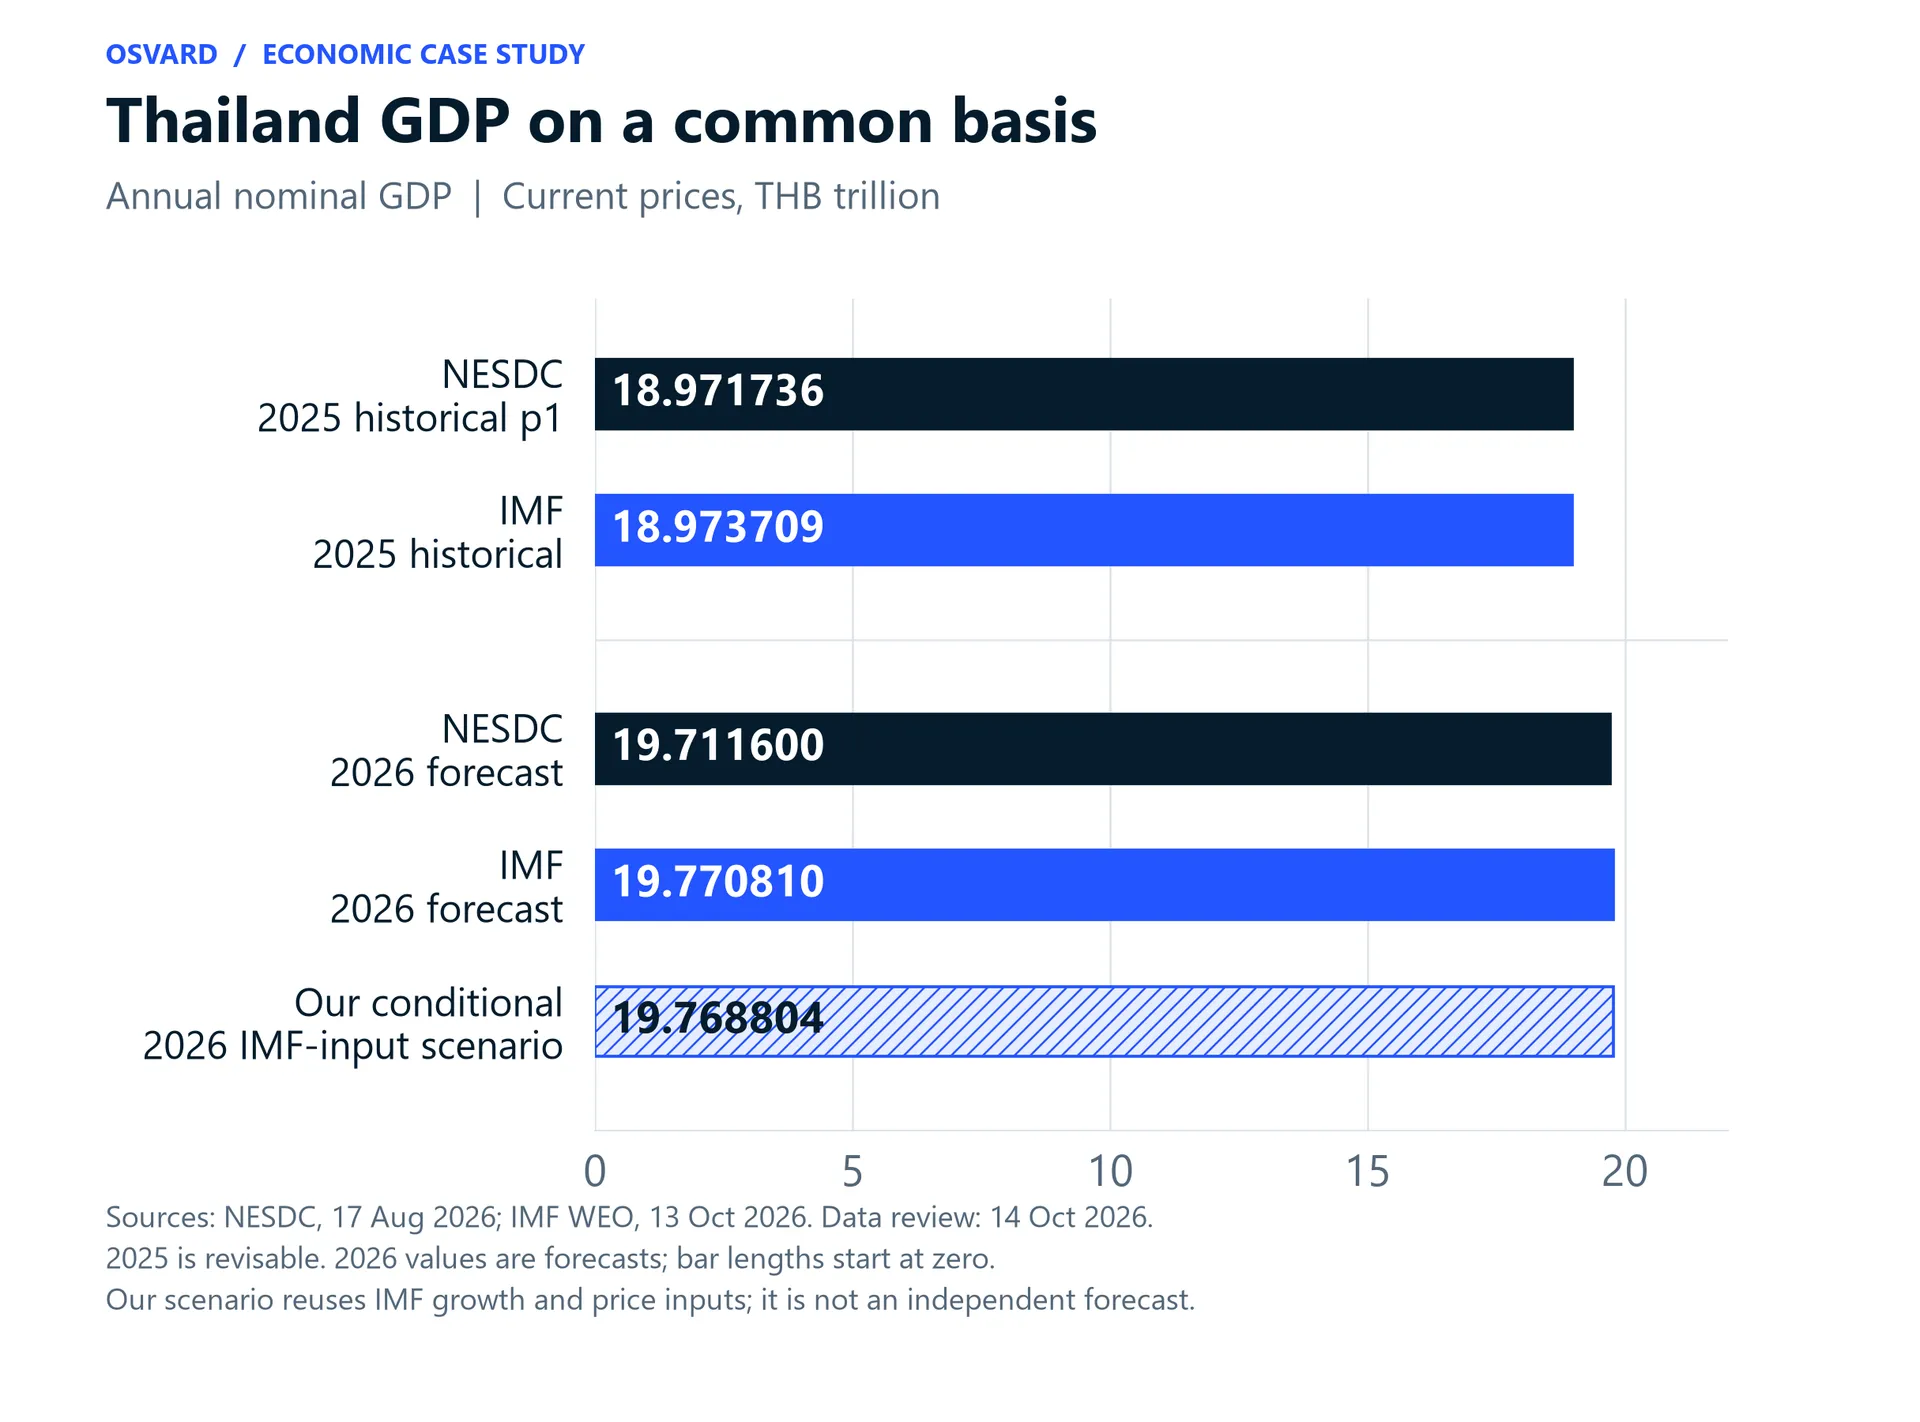
The next step takes us from historical accounts to the current year’s outlook. In its outlook published on 17 August 2026, NESDC forecasts nominal GDP of THB 19.711600 trillion. The IMF’s WEO, released on 13 October, forecasts THB 19.770810 trillion. NESDC’s figure is THB 59.210 billion lower, or 0.2995% below the IMF forecast.
The real-growth forecasts also sit close together. NESDC gives a range of 2.0% to 2.5% and a published point estimate of 2.2%. The IMF forecasts 2.1%, which lies inside the Thai range. We keep NESDC’s stated 2.2% rather than replacing it with the arithmetic midpoint of the range.
At first glance, the combination may seem puzzling: NESDC has a slightly higher real-growth point estimate but a lower baht GDP forecast. The starting GDP level and expected prices also influence that baht total. NESDC expects GDP-wide price growth of 1.5% to 2.0%; the IMF’s published price indexes imply about 2.0581%.
The two outlooks were released about eight weeks apart, using different information sets. We can compare their forecasts, but we cannot yet judge them against a completed 2026 annual result. Their price assumptions help us understand why real and nominal figures can move differently; the documents do not establish the precise cause of the entire forecast gap.
Thailand GDP on a common annual basis
| Calendar year and status | NESDC, THB trillion | IMF October 2026, THB trillion | NESDC minus IMF, % |
|---|---|---|---|
| 2024 historical | 18.683888 | 18.683888 | 0.0000% |
| 2025 historical, revisable | 18.971736 | 18.973709 | −0.0104% |
| 2026 full-year forecast | 19.711600 | 19.770810 | −0.2995% |
Thailand GDP on a common basis
 Open figure at full size (opens in a new tab)
The headline changes when we add prices and currency
To understand the baht forecast, we looked more closely at how output and prices fit together. The IMF uses a broad GDP price measure called the GDP deflator. It covers the goods and services included in GDP. Consumer price inflation measures a different set of prices, so it cannot simply replace this GDP-wide measure.
The published 2026 inputs make the relationship visible. The IMF reports real GDP of THB 11,768.061 billion at its reference prices and a GDP deflator index of 168.004. Multiplying the real GDP figure by the index and dividing by 100 gives nominal GDP of THB 19,770.813 billion. That is almost identical to the published THB 19,770.810 billion; the residual of around THB 3.2 million is consistent with the precision of the published inputs.
In growth terms, real output rising by 2.1% and GDP-wide prices rising by about 2.06% correspond to nominal growth of about 4.20%. Simply adding the rates is close but does not give the exact answer, because the output and price changes interact.
Converting the headline to dollars adds one more step. The IMF publishes 2026 GDP of USD 599.115 billion alongside its baht total. Dividing the baht value by the dollar value gives an implied conversion rate of approximately THB 33 per US dollar. We derive that rate from the two GDP series; it is not a directly published WEO exchange-rate forecast or an observed rate for the completed year.
NESDC forecasts GDP of USD 597.3 billion and uses an exchange-rate range of THB 32.5 to 33.5 per dollar, with a midpoint of 33.0. A further measure, purchasing-power-parity GDP, compares purchasing power across countries using a different conversion method. We keep it separate from these market-dollar values.
What happens if we give both calculations the same assumptions?
By this point, we had a close historical match and two similar forecasts. That led to a useful follow-up question: how much would the result change if we started with NESDC’s 2025 GDP but used the IMF’s assumptions for 2026?
We took the reconstructed Thai base of THB 18.971736 trillion, increased real output by 2.1%, and applied the change in the IMF’s GDP deflator from 164.616 to 168.004. The calculation is: 18.971736 × 1.021 × (168.004 ÷ 164.616) = THB 19.768804 trillion.
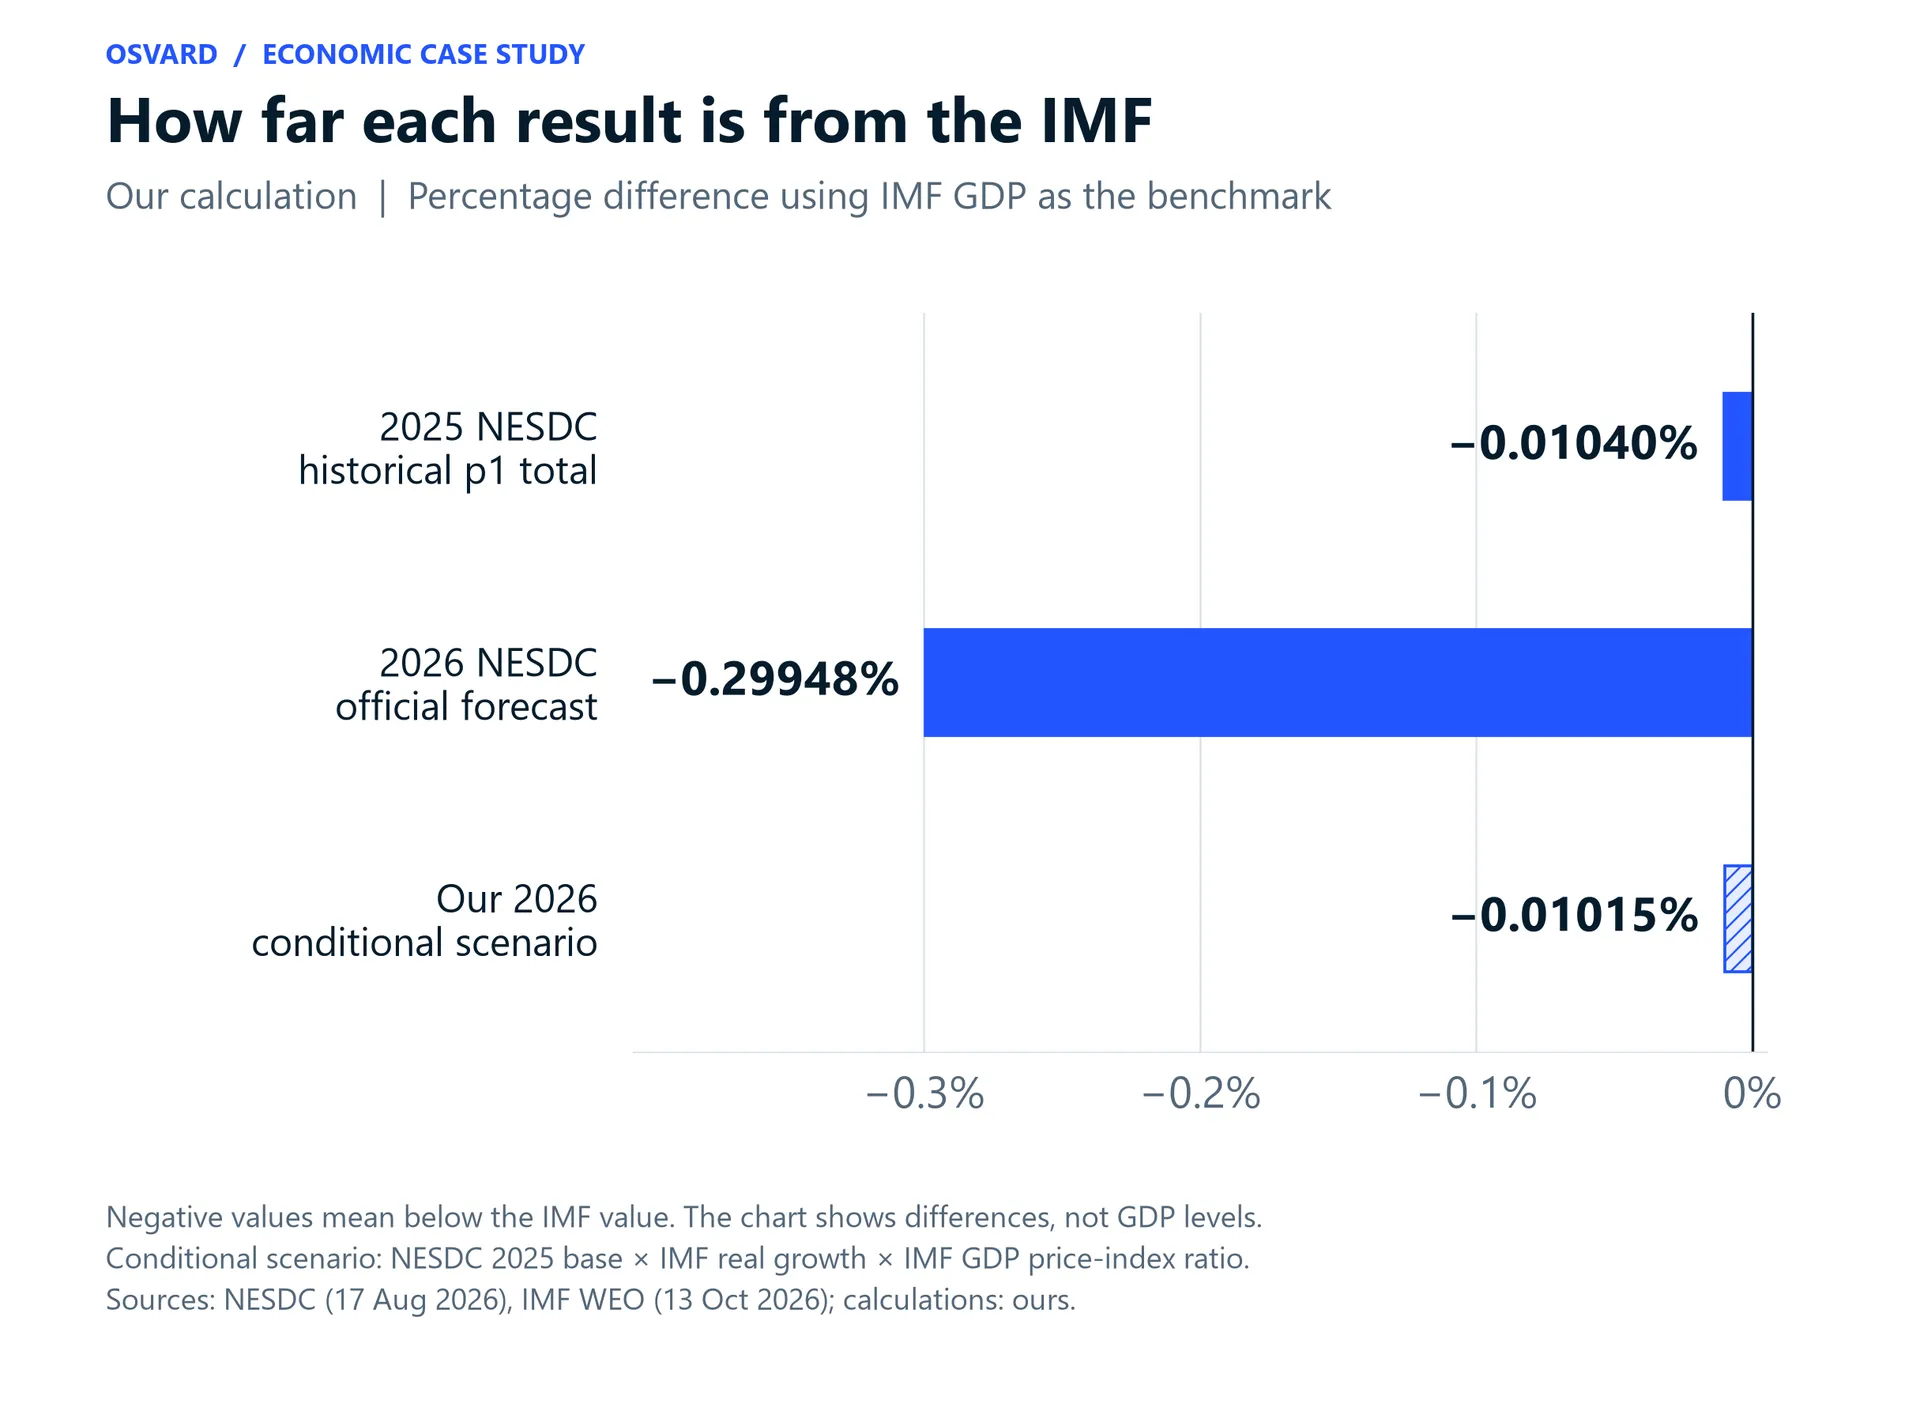
That result is only THB 2.006 billion, or 0.01015%, below the IMF’s 2026 forecast. Once we use common growth and price assumptions, the calculations nearly coincide. The remaining difference reflects the starting GDP level and the precision of the published series.
This is a conditional scenario using IMF inputs, rather than our own independent forecast. We are asking what follows if those assumptions are used. We are not establishing that the assumptions will happen or that final GDP will equal the result.
For an assessment, that distinction is useful. A reader can see the starting point, follow the calculation and understand which inputs would need to change to produce a different outcome.
How far each result is from the IMF
 Open figure at full size (opens in a new tab)
The date on a forecast is part of its meaning
A forecast is a view prepared with the information available at a particular time. The IMF’s press release on Thailand’s Article IV consultation, published on 13 February 2026, projected 2026 real growth of 1.6% and nominal GDP of THB 19.3412 trillion. By the October WEO, the projections were 2.1% and THB 19.770810 trillion. The real-growth forecast had risen by 0.5 percentage points.
Those figures belong to different forecast releases, often called vintages. Pairing the older IMF outlook with a newer Thai outlook can hide this timing difference. We therefore use October’s WEO as our IMF benchmark and keep the August date beside NESDC’s forecast.
The IMF explains that its country teams combine national information and country analysis with common global assumptions. The October WEO database appendix states an information cutoff of 30 September 2026. Thailand’s rows were updated on 25 September. The assumptions include established policies and an exchange-rate basis drawn from 31 July to 28 August. These dates tell us what went into the outlook; they do not guarantee what happened afterward.
The published material does not reveal every modeling choice. Thailand’s public projection-basis field is blank. We can reproduce the published accounting relationships, but the full country-team model and its judgment are outside the evidence available for this review.
Debt ratios offer another check, if the periods match
We then approached GDP from another direction. If a source gives both a debt amount and its debt-to-GDP ratio, dividing the amount by the ratio expressed as a decimal reveals the implied GDP denominator. It is a useful consistency check, though a rounded ratio cannot recover an exact GDP figure.
For Q4 2025, BOT’s household-debt data report debt of THB 16.470407 trillion and a ratio of 86.8%. Working backward gives GDP of THB 18.975123 trillion, about 0.018% above NESDC’s annual total. That small difference is consistent with the ratio being rounded to one decimal place.
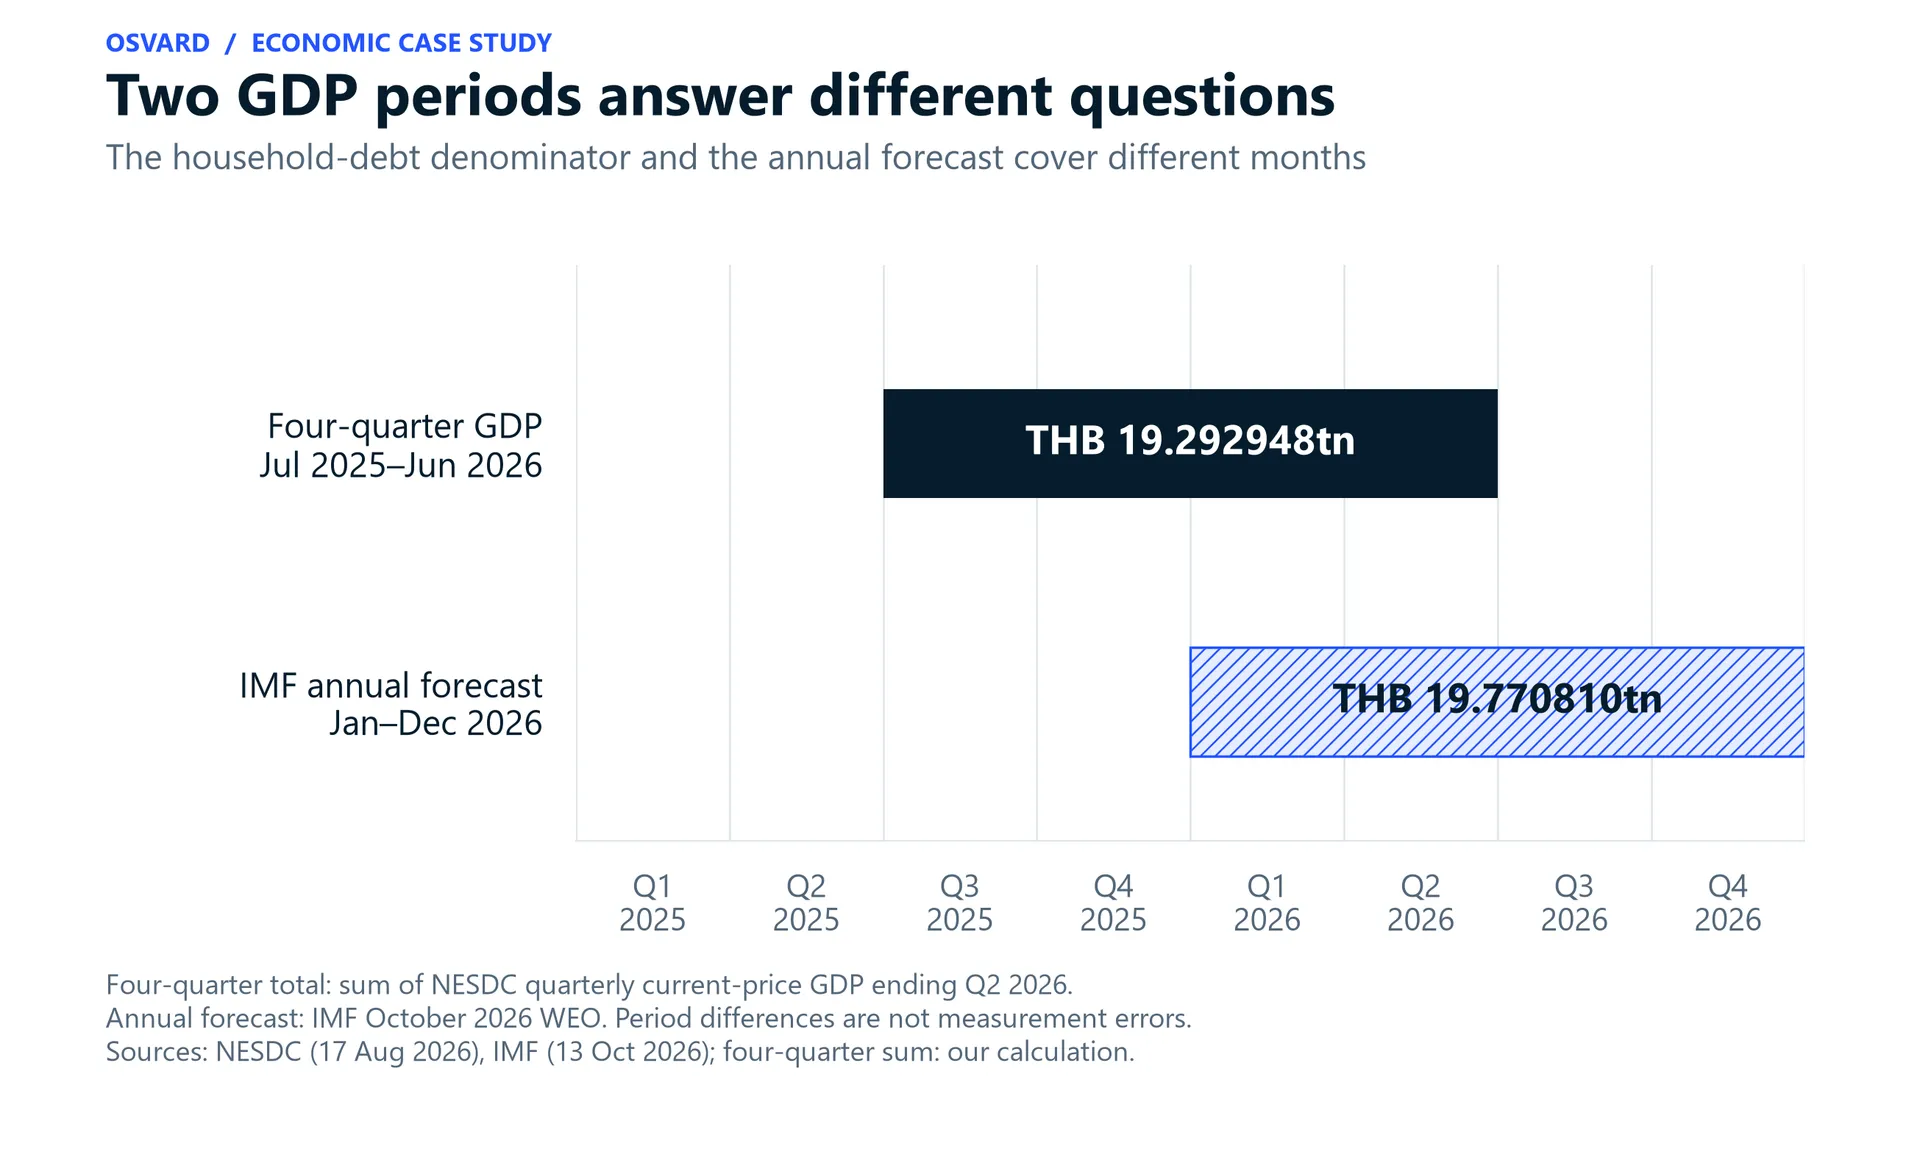
The Q2 2026 figures need more care. Debt of THB 16.432156 trillion and a ratio of 85.2% imply GDP of THB 19.286568 trillion. BOT uses GDP for the preceding four quarters. When we add the corresponding NESDC quarters, from July 2025 to June 2026, we get THB 19.292948 trillion. The reverse-calculation gap of roughly 0.033% is again consistent with rounding.
That twelve-month window is not the January-to-December period used in the 2026 annual forecasts. Comparing the rolling total with the IMF’s annual forecast cannot tell us that the forecast is wrong. Allowing for the rounding of 85.2% gives an implied GDP range of about THB 19.2753 to 19.2979 trillion. The directly summed quarterly total falls within it.
Public debt gives a third figure. PDMO’s end-August 2026 summary reports debt of THB 13.19183786 trillion and a ratio of 67.94%, implying GDP of THB 19.416894 trillion. The reviewed summary does not establish the exact GDP reference period. We therefore leave it labeled as an implied denominator rather than presenting it as a new full-year GDP result.
These checks help us assess whether debt figures fit their GDP basis where that basis is known. They do not provide a new measurement of GDP. Household debt and public debt also have different definitions, so we retain their separate labels.
What the debt-derived GDP figures mean
| Debt series and period | Debt, ratio and implied GDP | Correct interpretation |
|---|---|---|
| Household debt, Q4 2025 | THB 16.470407tn / 86.8% gives THB 18.975123tn | Four quarters ending Q4 2025; close to annual GDP within ratio rounding |
| Household debt, Q2 2026 | THB 16.432156tn / 85.2% gives THB 19.286568tn | Four quarters ending Q2 2026; compare with THB 19.292948tn for July 2025–June 2026 |
| Public debt, end-August 2026 | THB 13.19183786tn / 67.94% gives THB 19.416894tn | Implied GDP denominator; exact reference period unconfirmed in the reviewed summary |
Two GDP periods answer different questions
 Open figure at full size (opens in a new tab)
What we can take from the full story
We started with a simple question about Thailand’s GDP. Following each figure’s source, period and assumptions gives us a coherent picture: our reconstruction matches the official Thai historical total, and the Thai and IMF annual forecasts are close. Our conditional scenario explains why calculations nearly coincide when they share growth and price assumptions. The debt checks show why matching the time period matters just as much as matching the number.
This is how we can make an economic assessment useful for a business plan, project review or financial discussion. We explain how the result was reached, separate reported outcomes from forecast assumptions, and make the comparison possible to inspect and reproduce.
The evidence also tells us where to stop. We cannot establish the exact cause of the small 2025 residual, recreate the full IMF forecasting model, or confirm PDMO’s GDP reference period from its August summary. Historical data and forecasts can change. GDP levels alone do not tell us how much a particular policy caused growth.
As Thailand hosts the IMF and World Bank meetings, the practical value is in reading the figures with their context intact. The numbers reconcile closely, but their meaning still depends on their period, price basis, publication date and assumptions. Understanding those details gives us a clearer basis for the next decision.