
Understanding about “Levelized Cost of Energy (LCOE): What should we know, what should we do?
A consistent cost basis makes energy options easier to compare. Uncertainty and wider system costs still deserve a separate look.

The short version
- LCOE relates lifetime generation costs to lifetime energy output.
- Financing, operating costs and calculation methods shape the result.
- Storage, networks and environmental effects need separate consideration.
Understand the comparison the number is making
Levelized cost of energy, or LCOE, brings the estimated costs of a generating system together with the energy it is expected to produce over its lifetime. Expressing the result per unit of energy provides a common starting point for comparing generation options.
The attraction is easy to understand: a large set of project assumptions becomes one readable figure. That convenience needs care. Each figure rests on a particular calculation method, cost scope and estimate of future output. Understanding that basis is part of understanding the comparison.
Follow the costs and output through the project period
A lifetime calculation brings together events that occur at different times. Equipment investment may be concentrated near the beginning, while operation, maintenance and energy production continue over the study period. Later replacement or changes in operating assumptions may also matter where included in the chosen scope. Listing the events and their timing makes the reported cost easier to understand than a single total without supporting detail.
The calculation method determines how those time-dependent amounts are compared. A discounting approach relates future costs and output to an agreed basis; an annuitizing approach expresses relevant costs through annualized treatment. These approaches need their own consistent assumptions. The practical task for a reader is to understand the method actually used, including the period, financial treatment and output basis, before placing its reported figure beside a result from another study.
Use a consistent present-value basis
- Convention
- State real or nominal money, discount-rate treatment and output timing consistently.
- Boundary
- Identify which generation, operating and supporting costs are included.
Look through the figure to the underlying assumptions
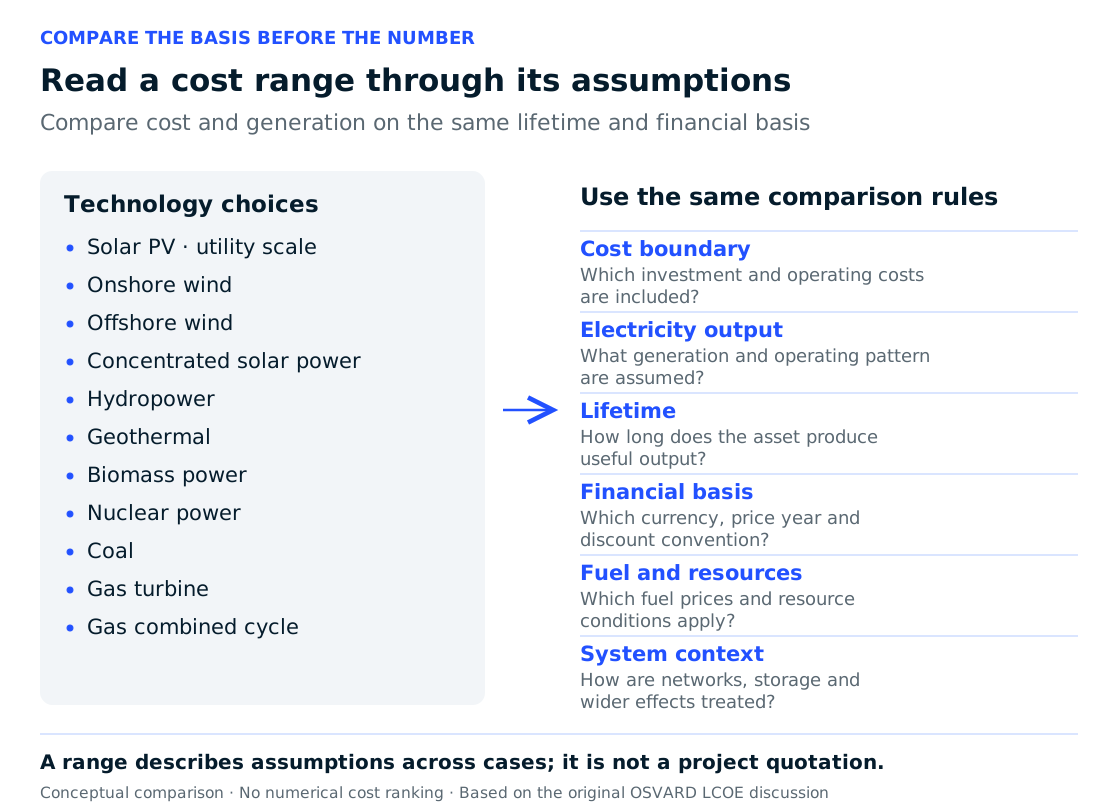
Investment expenditure, operating and maintenance costs, fuel and financing assumptions are inputs to the calculation. Expected generation and project lifetime also shape the relationship between total cost and total output. A change in those assumptions can change the resulting LCOE.
Before comparing two studies, examine whether they use comparable periods, cost definitions and financial assumptions. Different calculation approaches include discounting and annuitizing methods. The practical reading question is whether the figures describe sufficiently similar things for the comparison you want to make.
Compare studies that answer the same question
Two LCOE values can refer to different services or boundaries even when both are expressed in the same units. One estimate may describe a generating asset at a particular operating pattern, while another uses different output or cost assumptions. Location, financing and the period considered can also affect the comparison. The unit of measurement makes the figures readable; it does not establish that the underlying cases are equivalent.
A comparison sheet can therefore include the generation option, study period, expected output, investment and operating scope, and calculation method. Mark information that is unavailable rather than fill it with an assumed common value. Where a difference is material, explain what it means for the intended decision. This approach allows a benchmark to remain useful while showing the work required before it can support a project-specific judgment.
LCOE also has a particular role within a financial discussion. It is a generation-cost measure, so the project still needs its revenue, demand and commercial arrangements examined separately. A lower reported generation cost does not, on its own, describe the price received or the timing of cash flows. Keep the cost comparison connected with the service the project provides and the economic assumptions used in the wider feasibility study. This makes the metric useful to a reader evaluating an investment: the number helps clarify one part of the case, while the accompanying study explains the other conditions required for that case to be workable.
Read a cost range through its assumptions
 Open figure at full size (opens in a new tab)
Ask what uncertainty could change the answer
An energy project extends into the future, so several inputs are estimates rather than observed final values. Costs and expected generation may develop differently from the original assumptions. A single figure can make those uncertainties harder to see if the supporting information is missing.
Use the calculation as a way to open questions about the comparison. Which inputs have the strongest influence? What happens if an important cost or output assumption changes? Could a different assumption alter the ordering of the options? Showing those questions alongside the figure helps readers understand how much confidence to place in the result.
Use uncertainty to frame a decision rather than a ranking
A central estimate represents one collection of assumptions. Exploring alternatives can show whether the comparison is sensitive to output, investment, operating costs or financing treatment. The purpose is to understand which information could change the decision. A wide range may indicate that an option deserves further study, while a stable qualitative conclusion may still depend on issues outside the generation-cost boundary.
For an early review, describe a small set of plausible cases and the assumptions separating them. Keep the cases consistent enough to identify the reason for a change. If a different financial or output assumption changes the ordering, make that relationship explicit. The result is a more useful discussion of confidence and next steps, with no need to present an uncertain figure as a precise prediction of what the project will ultimately cost.
A comparable number needs a comparable basis
| Basis | What to check |
|---|---|
| Cost scope | Investment, operation, maintenance, fuel and financing treatment |
| Energy output | Generation assumptions and project lifetime |
| Calculation method | Period, discounting or annuitizing approach |
| System boundary | Whether networks, storage or other wider effects are included |
Place generation costs inside the wider system
A generation cost metric can have a restrictive scope. Transmission, distribution and storage may need additional consideration, while environmental effects may sit outside the cost boundary used in a particular study. Check the actual study scope before assuming these factors are included or excluded.
A useful energy comparison therefore explains both the number and its boundary. State the generating system being assessed, the costs covered and the wider issues left for further analysis. That gives readers a clearer basis for discussing the option in its setting, alongside the other evidence needed for the decision.