How to Choose What Belongs on a Shared AI Platform
Three teams need AI for different jobs. Reviewing their requests in a group budget meeting shows where a common platform could help, what still belongs with each business, and what the group needs to learn from a pilot before expanding a service.
How to Choose What Belongs on a Shared AI Platform
Three teams need AI for different jobs. Reviewing their requests in a group budget meeting shows where a common platform could help, what still belongs with each business, and what the group needs to learn from a pilot before expanding a service.
Shared computing infrastructure beside business workspaces. Illustrative scene.
The short version
Some jobs, such as arranging access, connecting systems, and agreeing supplier terms, can be done for several businesses at once. Others need a specialist application or somebody who knows the local work.
Adoption, portfolio value, and hours released answer different questions. To use each figure, the group needs to know who or what it covers and when it was measured.
A useful pilot follows a job through to an accepted result. It counts checking and corrections as well as the AI bill, and gives named people authority over the outcome.
01
Three teams bring three different requests
Three requests reach a fictional group budget meeting. Customer service wants help sorting inquiries and drafting replies. Finance is after answers from approved policies, while engineering wants an assistant inside the software its developers already use. The information they use and the standard of a good answer differ. The scene is illustrative.
There may be only a few subscriptions to approve at first. Behind them are connections to existing systems, access to information, and people who will have to support the service. Somebody also has to check the answers. Separate tools could get the teams moving sooner, although each might then build much the same connections and controls. A common service could remove that repeated work if it can also accommodate a specialist need.
02
Sharing technology still leaves a choice about delivery
The platform supplies the technology. People still have to choose what it does, approve changes, and help colleagues when it fails. The operating model sets out how those jobs are divided. The same platform can be run in more than one way.
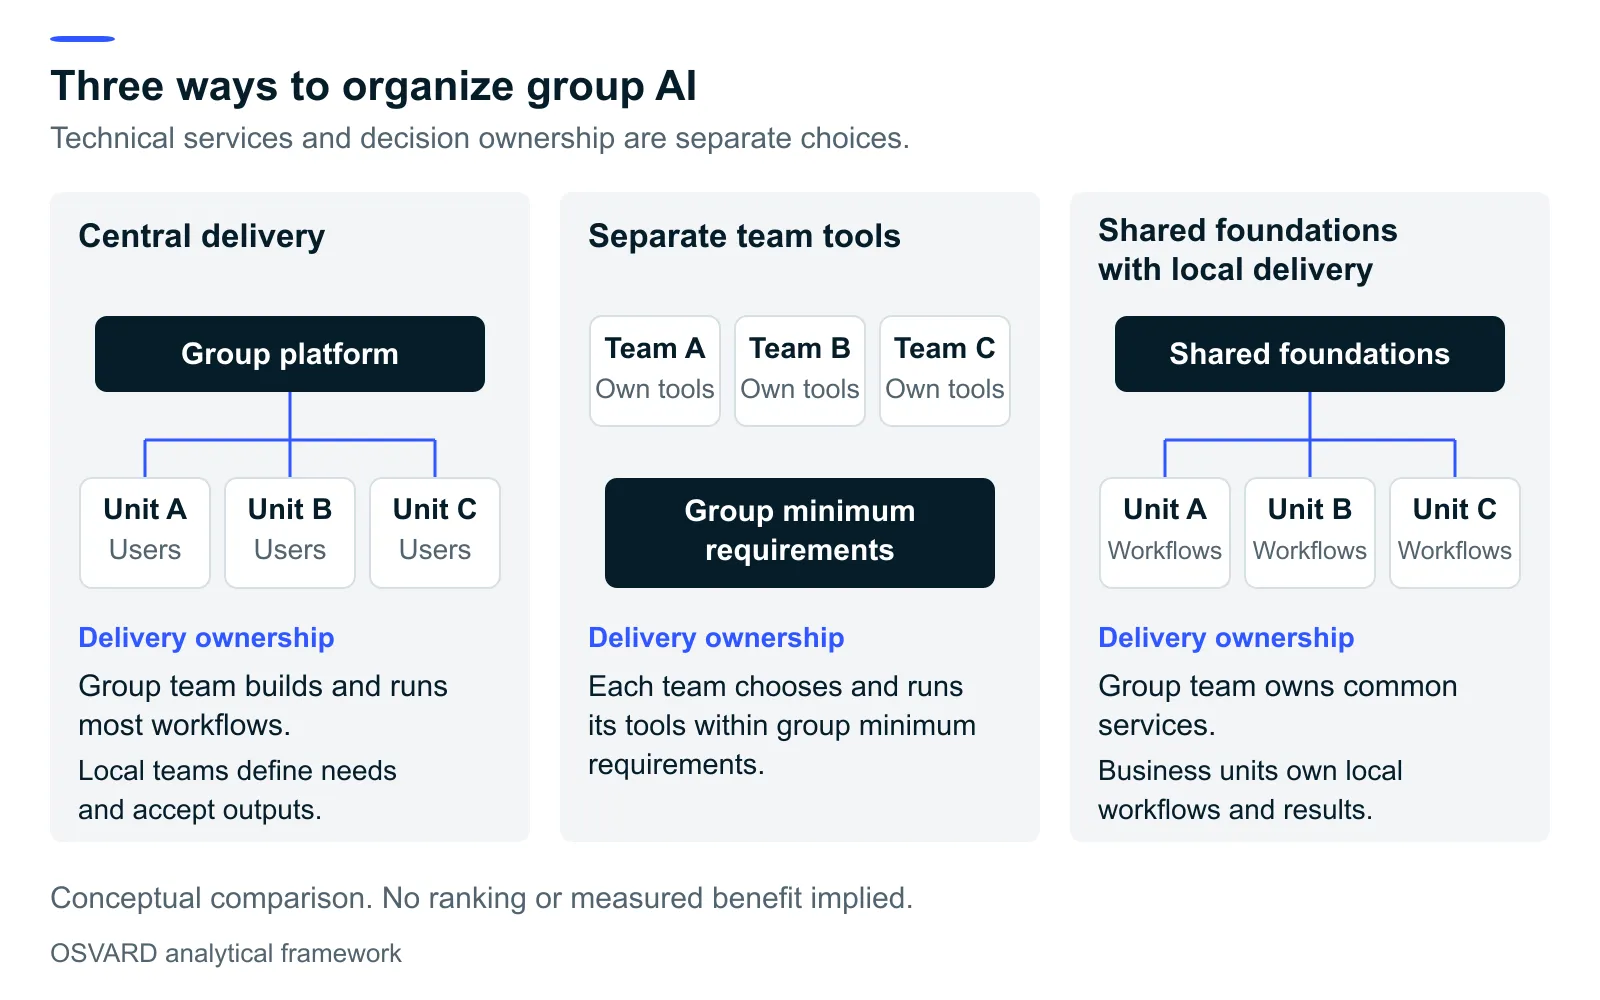
With central delivery, the group team runs common access and controls and builds most workflows. Repeated needs can make this attractive, if that team has the expertise and capacity to serve the businesses. Delivery pace matters as much as the catalog of available services. A business still needs a practical way to obtain an essential change.
With separate team tools, each business chooses and operates applications within group requirements. A specialist task with limited demand may warrant its own tool. The business then needs people and budget for supplier management, integration, support and oversight, as well as the application itself.
The group could instead run services that several businesses can reuse, leaving local teams to build their workflows and accept the results. This arrangement is called federation. It can accommodate several vendors, models, and hosting locations, with data kept in existing repositories. The teams still need to test the costs, as they would for the other options. They also need an agreed way to request changes and a clear account of the service they can expect.
Three ways to organize group AI
Open figure at full size↗ (opens in a new tab)OSVARD conceptual comparison of three delivery arrangements. The same technical platform can support different decision rights. The diagram implies neither progression nor a quantified benefit.03
Where shared foundations can help
Finance and another business could use the same connection to approved documents while keeping their own policies current. The platform team could maintain that connection, check sign-ins, and record usage. Each business would check the answers against its own material. An outdated policy would need a different response from a broken connection. Before sharing the service, the teams would need to agree who handles each problem.
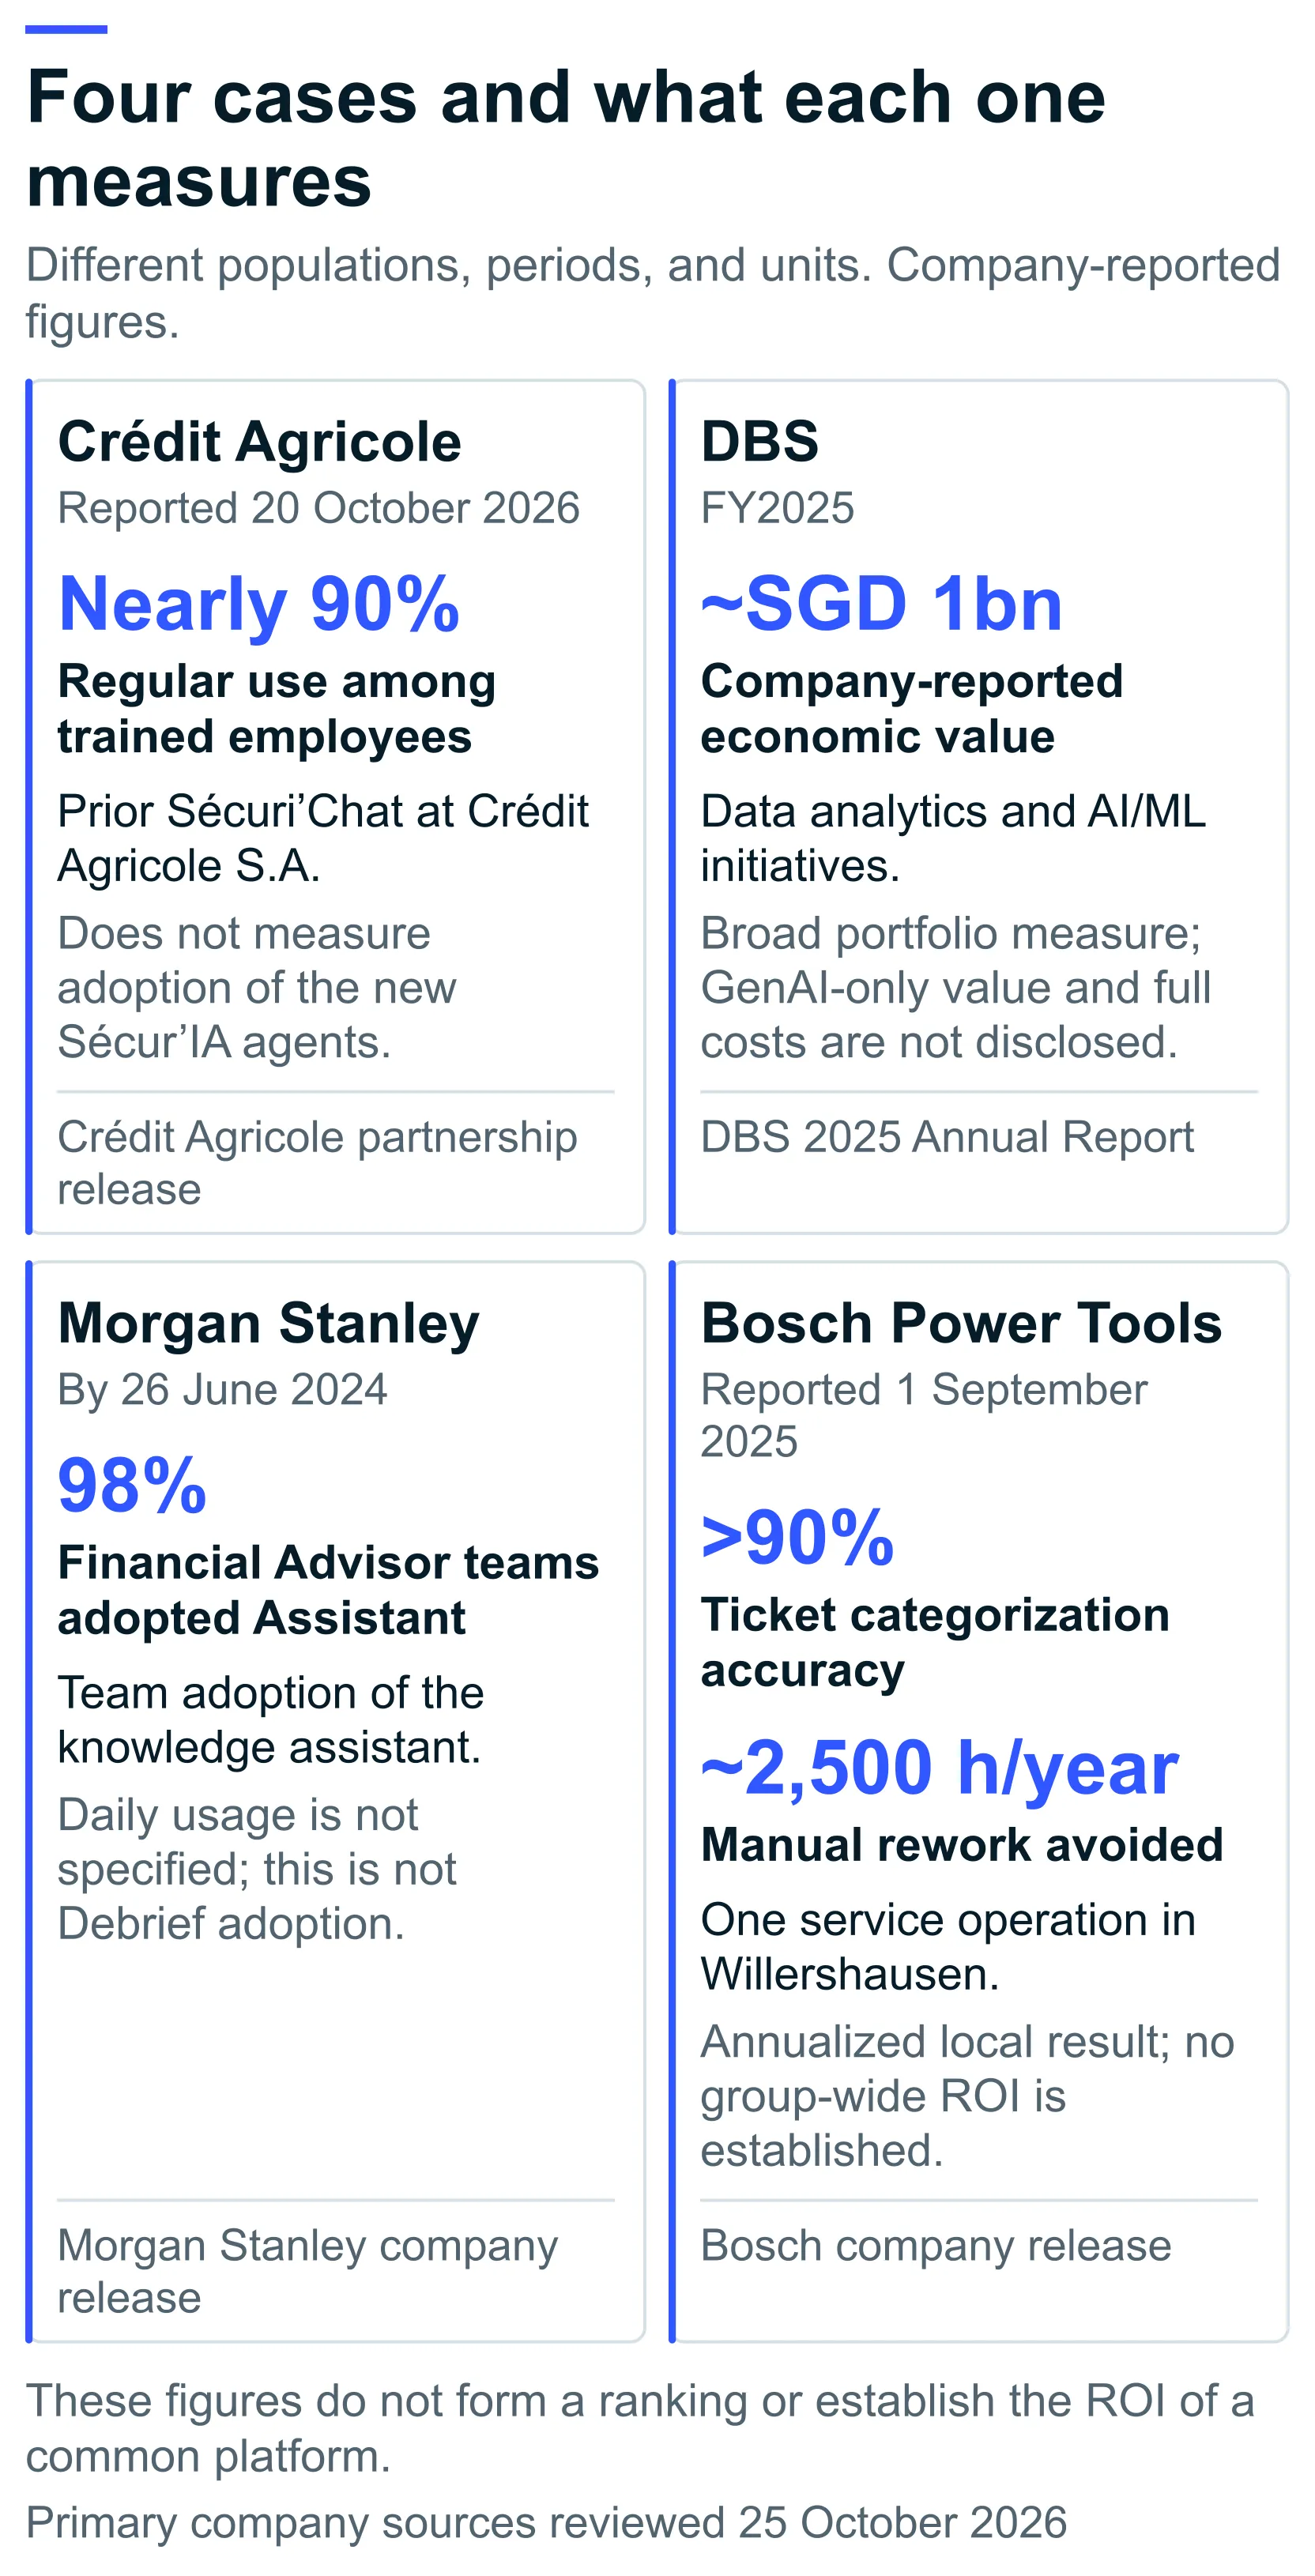
The proposed AI company would supply technology that Crédit Agricole’s businesses could use in their own transformations. That was the model set out on 10 June 2026, alongside nearly €500 million of planned AI investment for 2026–2028 from its medium-term IT plan. CA-GIP would coordinate computing according to the information’s sensitivity and how critical the task is, using private cloud, European partners, and complementary solutions. Crédit Agricole’s June announcement
A usage figure in Crédit Agricole’s October release belonged to the earlier Sécuri’Chat, regularly used by nearly nine out of ten trained Crédit Agricole S.A. employees. In the fictional group’s own trial, the usage record would sit alongside the quality and cost of completed work. Crédit Agricole’s October announcement
04
Choosing a measure that fits the question
DBS’s 2025 annual report takes a portfolio view. It reports approximately SGD1 billion of economic value in 2025 from data analytics and AI/ML, a broader scope than generative AI or a single employee assistant. The same report describes an enterprise data platform and a generative AI framework with reusable components and governance standards. More than 2,000 models span over 430 use cases. For the director considering one workflow, the useful distinction is the unit being measured. A portfolio total and the record of one service provide different views. DBS 2025 CIO statement
Morgan Stanley’s release of 26 June 2024 turns to a different measure, adoption. It reports that 98% of Financial Advisor teams had adopted Assistant for internal knowledge access. The release also introduced Debrief, which prepares meeting notes and follow-up drafts with client consent and advisor review. The 98% refers to teams adopting Assistant, rather than all employees, daily users, or Debrief users. In the fictional group’s pilot, the record would likewise need to identify who was counted and which activity counted as use. Morgan Stanley’s announcement
The ticket figures at Bosch came from its Power Tools service operation in Willershausen. Its 1 September 2025 release described categorization above 90% accuracy and around 2,500 hours of manual rework avoided annually. A rollout to 23 service locations was planned. For the fictional group, the useful link is between quality and time released from a particular job. A rollout plan and a result at one site would remain separate entries in the record. Bosch’s service case
The four figures bring the discussion back to the fictional group’s budget meeting. Finance could count accepted answers to policy questions, then record the time spent checking them and the full cost for the same period. Customer service would need records for its own work. Each business could test the proposal on tasks it actually performs. The worksheet below connects the measures available to the decisions they could support.
Four cases and what each one measures
Open figure at full size↗ (opens in a new tab)The four companies reported figures in different units, for different groups and periods. They cannot be used to rank the companies. Crédit Agricole’s usage figure is for the earlier Sécuri’Chat. DBS counts value across data analytics and AI/ML. Morgan Stanley counts Financial Advisor teams adopting Assistant, while Bosch reports results from one service operation.
What each measure can help decide
Measure
Question it helps answer
Record needed
Decision it informs
Usage
Are eligible teams continuing to use the service?
Tool, user group, activity, and period.
Training and adoption support.
Portfolio value
What value is recorded across the defined set of applications?
Initiatives included and the method used to assess value.
Portfolio priorities and further investigation.
Workflow quality
How often does the output meet the agreed standard?
Representative cases, acceptance rules, and material errors.
Release, review, and improvement work.
Time released
Where can the team use the capacity created?
Whole-job effort, later rework, and available work to absorb the time.
Capacity planning and the separate assessment of cash savings.
OSVARD assessment worksheet. The company examples above illustrate different measures; this table suggests how a group could define its own records and decisions.
05
One decision at a time
For finance, the first question is whether another business needs the same connection to documents. Sharing that connection would still leave each business with its own policies and reviewers. The matrix works through six factors—repeated needs, specialist fit, data access, full costs, delivery capacity, and the effort of changing provider. Each cell identifies conditions for the team to investigate. OSVARD uses the matrix to explain a choice for a particular service, without weighted company scores or an assumed winner.
The engineering application may be a different story. If only one specialist team needs it, other businesses have little reason to buy this application. Shared sign-in and usage records could still be useful. Finance might use the group’s search and testing services while keeping responsibility for its policies and the answers. Each choice needs to fit the job it will support; one answer for the whole group would miss these differences.
Each option needs a short account of the work and the people who will do it. For a shared service, that means naming the repeated tasks it would remove and the team that would keep it running. A specialist tool needs a reason for its extra support costs. Shared foundations with local delivery need capacity on both sides. The decision record should keep those reasons beside any questions the pilot still has to answer.
A decision matrix for group AI
Decision factor
Central delivery
Separate team tools
Shared core and local delivery
Repeated needs
Similar workflows recur across units.
Distinct needs justify repeated setup costs.
Shared components serve several units.
Specialist fit
Central expertise matches the task.
Local fit is distinctive.
Business teams retain domain design.
Data and controls
Access is defined by business and purpose.
Each tool meets group requirements.
Common controls preserve dataset access boundaries.
Full economics
Costs include platform operations and idle capacity.
Costs include local support and integration.
Common costs are allocated once alongside local costs.
Delivery capacity
Backlogs and service commitments fit demand.
Local skills and continuity support the service.
Both sides have sufficient delivery capacity.
Portability
Group dependency and exit effort are tested.
Each supplier has a recorded exit route.
Interfaces and a representative move are tested.
OSVARD assessment framework. Cells describe conditions to investigate, not scores or established company results. The preferred arrangement may vary by capability.
06
The cost of acceptable work
A subscription or model bill does not capture everything it takes to finish a job. FinOps guidance considers AI spending across infrastructure, enterprise agreements, and software, linking technology use to business value. This supports a fuller cost record. It does not demonstrate that a shared platform will be cheaper. FinOps for AI and FinOps unit economics
OSVARD proposes full cost per approved outcome. The calculation divides the workflow’s total cost by the number of results accepted under an agreed quality rule. It includes software and models, infrastructure, data preparation, integration, shared operations, support, training, review and rework. One-off implementation and recurring costs appear separately. The record also explains how common costs are allocated.
More drafts from the policy assistant could leave colleagues with more checking to do. Comparing the options means following the same work over the same period. A shared connection may remove repeated work, but the service still costs money to run when some of its capacity is idle. Time released gives people room for other work; it becomes a cash saving only when spending falls. The calculation counts accepted results, without treating rejected drafts or repeat attempts at the same job as extra productivity. Moving a cost from the platform budget to a business budget does not remove it from the total.
A cost ledger with a consistent boundary
Cost line
Cost record
Comparison basis
Tools and computing
License fees, model charges, hosting, and capacity.
Capacity paid for and capacity actually used are shown separately.
Implementation
Data preparation, connections to existing systems, and testing.
The record shows one-time costs and the period covered.
Shared services
Platform support, controls, and maintenance.
Each share of the common cost is visible and counted once.
Local operations
Training, support, and upkeep of the business’s knowledge.
The count includes work that stays with each business.
Review and rework
Checking, corrections, exceptions, and handoffs.
All options use the same rule for accepting an outcome.
This OSVARD worksheet makes no assumptions about prices or returns. The calculation divides all costs in scope by accepted results from the same workflow and period. One-time implementation costs and recurring costs are shown separately.
07
The result depends on the task
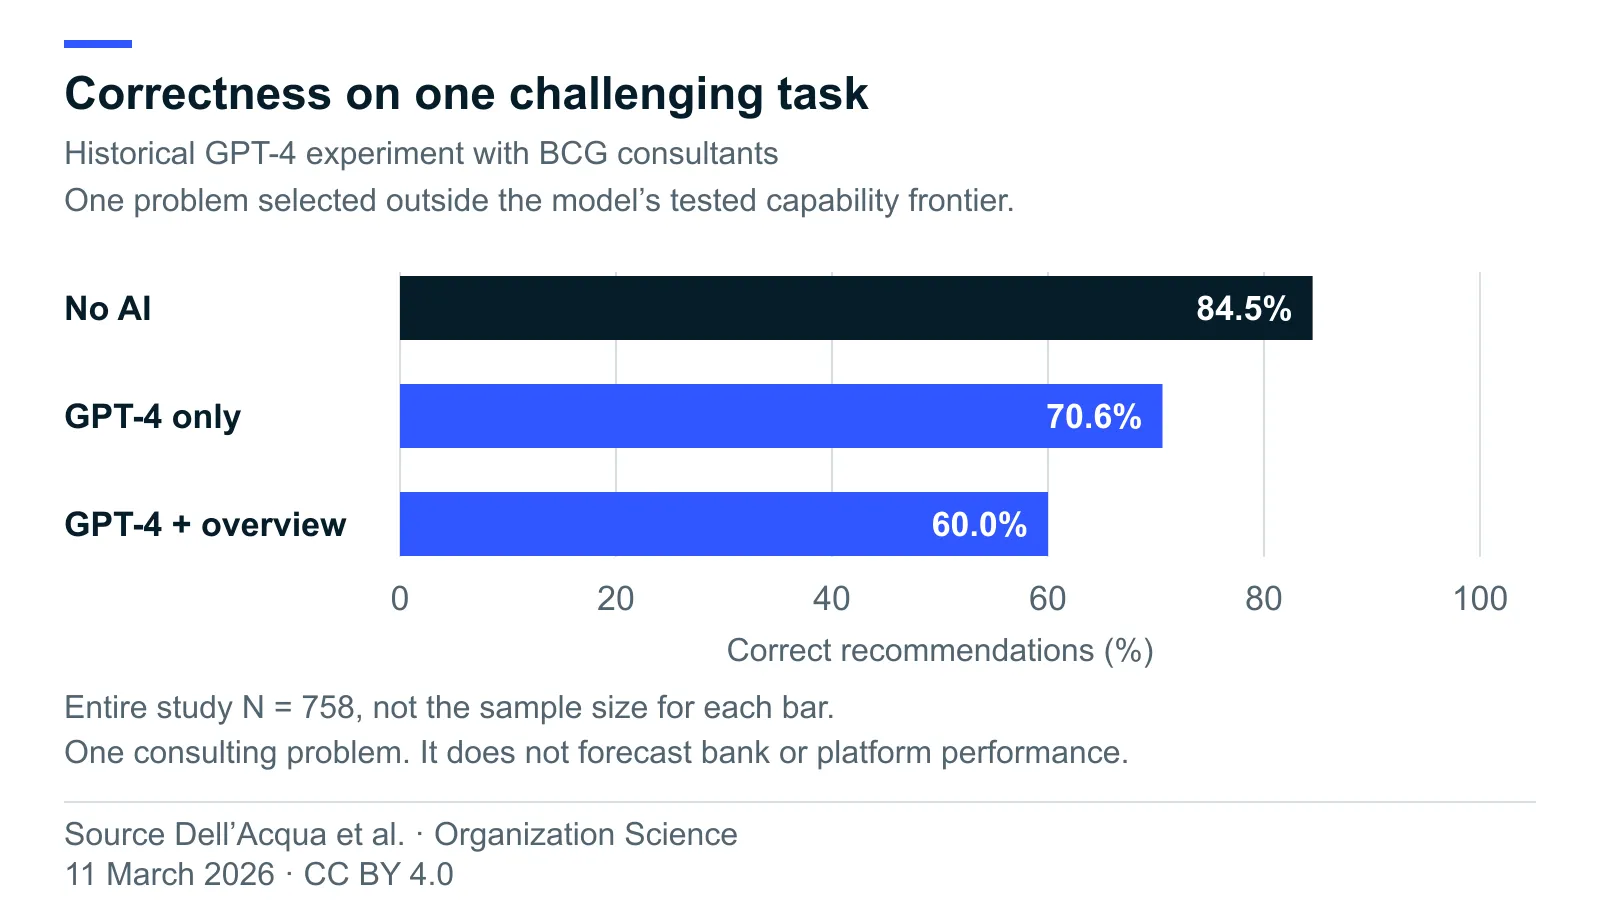
Task fit changed the outcome in a historical randomized experiment with 758 BCG consultants using GPT-4. The paper, published online on 11 March 2026, found 12.2% more tasks completed and work done 25.1% faster on tasks within the tested capability. For one complex task beyond that capability, correct answers were about 19 percentage points less common, on average, in the AI conditions than without AI. The study used specified consulting tasks and an earlier model generation; it does not predict current platform performance or compare purchasing arrangements. Dell’Acqua and colleagues. The chart is adapted under the paper’s CC BY 4.0 license.
The first answer is only part of a pilot. Finance may have to correct a response later, and that effort still belongs in the trial. Before testing starts, the team should agree what an acceptable result looks like. The time record then follows preparation, prompting, drafting, checking, handoffs, and exceptions. Reviewers need to see the difficult cases and material errors too. A separate usage record distinguishes people with access from those who tried the tool and those who kept using it to complete the intended work. Sample size, the observation period, and the application version should accompany each result.
What to check before expansion
Measure
Record needed
Decision rule
Quality
Accepted outputs and material errors on representative cases.
The domain owner agrees on thresholds before the test starts.
Total effort
Time spent preparing, producing, checking, and dealing with exceptions.
The whole job is compared with the way it was done before.
Rework
Corrections and later work needed for each accepted output.
Work passed to somebody else cannot count as a saving.
Adoption
Eligible users who complete the intended workflow over time.
The record separates access to the tool, a trial, and sustained use.
Unit cost
Full cost and the number of accepted outputs for the same period.
Each option must meet an equivalent acceptance standard.
Controls
Tests of permissions, incident handling, and overrides.
The team resolves material failures before expansion.
Portability
The effort involved and any quality change when a sample workflow moves.
The decision owner accepts the work and cost of leaving.
This is a worksheet for a proposed pilot, rather than a record of completed company tests. Before testing starts, the teams agree on sample size, user group, observation period, application version, owners, and thresholds. There is no universal pass rate.
The ownership map connects the technical services to the people who depend on them. Common services need owners for access, supplier terms, usage records, reliability, and reusable connections. Business owners need authority over test cases, acceptable results, and the consequences of use. Teams can share the work, but a named person still needs to make the release or acceptance decision.
NIST’s July 2024 Generative AI Profile is a useful reference for testing a service in its working context, keeping records of the tests and their results, and monitoring it after deployment. The guidance is voluntary. It provides neither certification nor a requirement to centralize. The ownership map here is OSVARD’s proposed way of applying those principles; NIST does not prescribe this division of work. NIST Generative AI Profile
A recurring task with a clear finish gives the teams a manageable first pilot. They can agree how the work is done today, who will take part, how long the test will run, what result is acceptable, and who will decide. Cost and quality belong in the review alongside permissions, incident handling, and the way out of the arrangement. Moving or rebuilding a sample workflow would test that exit in practice. The record should show the effort involved and any change in performance.
Disagreements will need somebody to resolve them. The platform may be available on time while its answers fail the business’s checks. A specialist tool may do the job well but need better access controls. The decision owner should record what the review found, what remains unresolved, and what would justify another look. A useful local experiment could continue under a temporary exception with an owner and a review date.
At the next budget meeting, the group should be able to show how the workflow performed in the pilot and who could support it on a larger scale. That could justify extending a common service, keeping a specialist tool, or changing a workflow that still produces weak results. Later changes in business needs, technology, or costs would be reasons to look at the decision again.
Who owns the shared and local work
Capability
Delivery arrangement
Accountable role
Identity and access
A group service applies business-specific permissions.
Group access owner
Supplier terms and metering
Common terms accompany transparent usage records.
Group commercial or platform owner
Connectors and evaluation tools
Reusable tools support local test cases.
Named platform service owner
Workflow design and knowledge
Business teams use approved services.
Business workflow owner
Output acceptance and review
Domain reviewers apply an agreed standard.
Domain acceptance owner
Release and incident response
Teams collaborate under one final decision owner.
One named release or incident owner
A service, release, or outcome may involve several teams, but it still needs one named person to be accountable. OSVARD proposes this ownership map as a starting point. The roles would need to fit the group’s organization.
An AI usage count shows activity. A pay review needs evidence of better work and individual contribution, with a fair account of the tools, training, and help available to the employee.


 Open figure at full size (opens in a new tab)
 Open figure at full size (opens in a new tab)
 Open figure at full size (opens in a new tab)