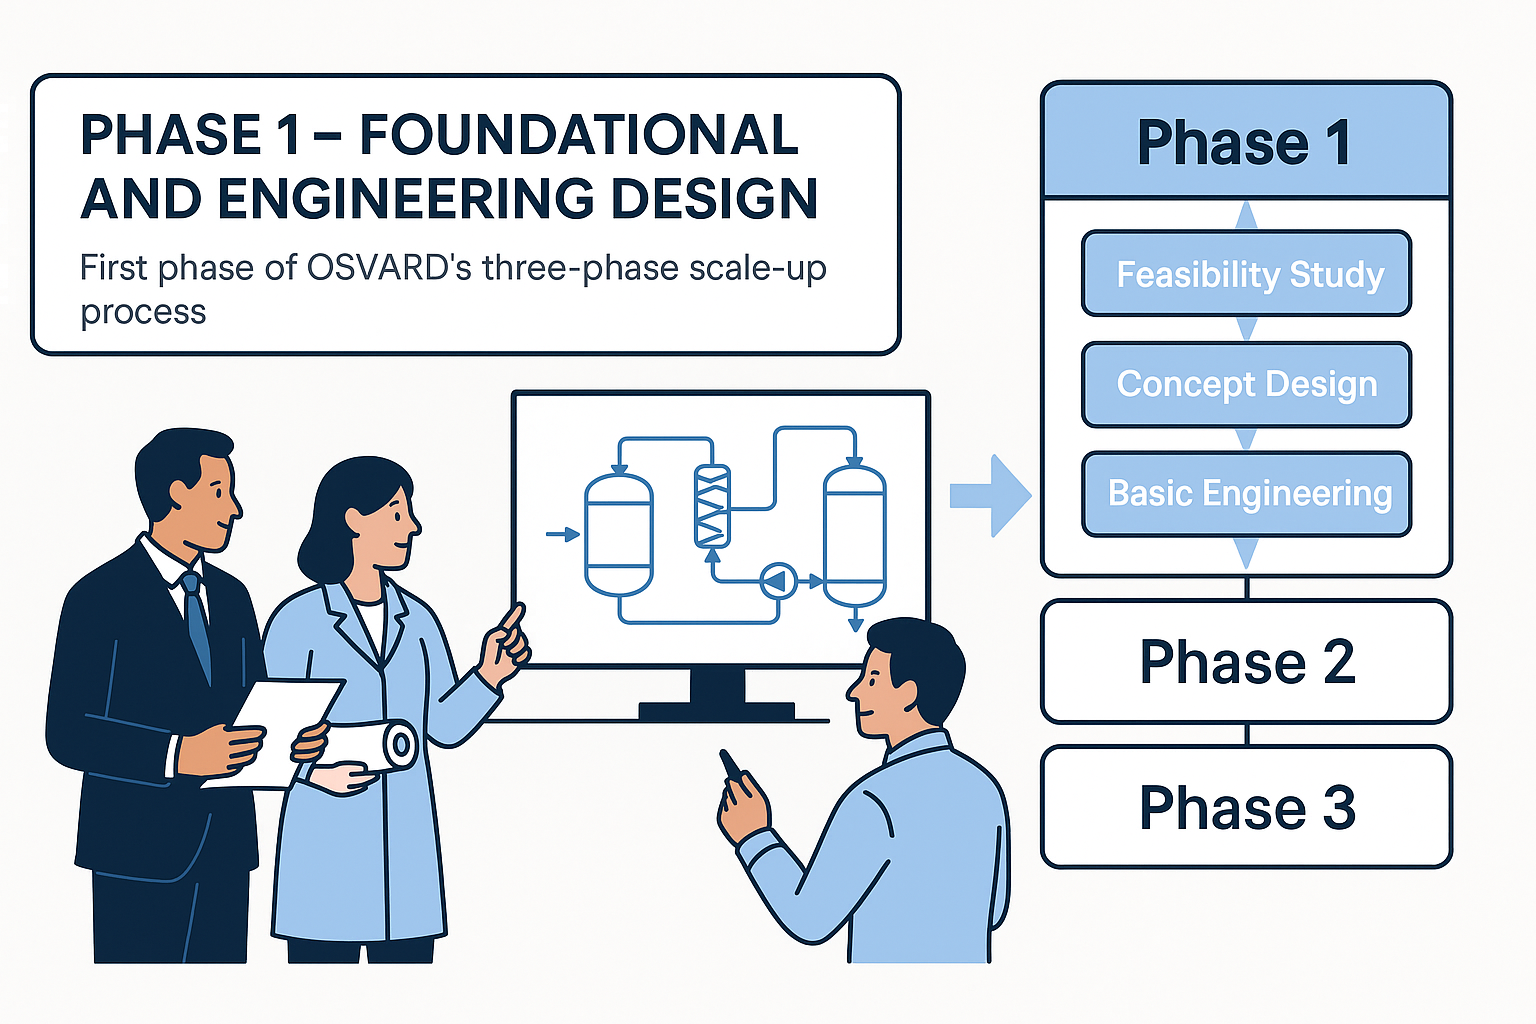
Phase 1 – Foundational & Engineering Design
Building the brains and backbone of your scale-up project
Phase 1 is where OSVARD transforms an exciting lab result into an actionable, risk-screened engineering concept. This is the intellectual heavy-lifting stage: questions are framed, numbers are crunched, and show-stoppers are flushed into the daylight while fixes are still inexpensive. Below is a deeper look at how we turn scattered data and early ideas into a complete Conceptual Design Report that can survive scrutiny from investors, regulators, and your own operations team.
1 | Feasibility That Goes Beyond “It Should Work”
Technical vetting. We begin with rigorous mass- and energy-balance calculations, thermodynamic checks, and kinetics reviews. If the chemistry looks marginal at scale—perhaps a side reaction threatens selectivity or cooling duty explodes with volume—we flag it immediately and model mitigation options (alternate solvents, staged feeds, or a catalyst upgrade).
Market and supply reality. OSVARD’s analysts verify raw-material availability, specification drift, and regional logistics. Discovering a feedstock is price-volatile or import-restricted now prevents headaches—and stranded assets—later.
Economic sanity test. Using ±30 % capex and opex estimates, we run discounted-cash-flow screens to confirm the project can clear your hurdle rate. If payback hinges on a single by-product credit or unproven subsidy, we highlight that risk and craft fall-back scenarios.
2 | Early Documents That Prevent Late Chaos
Process Flow Diagrams (PFDs)
Every major stream, duty, and control junction is captured. We attach a heat-and-material balance table with sensible data ranges, so later design tweaks always reference the same baseline.
High-level P&IDs
Even at this early phase we mark critical control loops, relief paths, and isolation valves. The drawing is a living index of hazard scenarios that PHA and HAZOP teams will refine in Phase 2.
Major-equipment datasheets
For each vessel, reactor, exchanger, pump, or compressor we list preliminary volume, duty, metallurgy, design pressure, and allowable turndown. Vendors can provide budgetary quotations straight from these sheets, aligning cost and lead-time expectations early.
Site-utility map
We sketch steam, condensate, power, cooling water, and instrument-air consumption vs existing capacity. If the pilot unit needs a 250 kW chiller but the building’s loop is maxed out at 150 kW, that gap is flagged long before purchase orders go out.
3 | Simulation-Driven Confidence
-
Steady-state models in Aspen Plus® or HYSYS® verify conversion, separation efficiency, and recycle ratios at proposed scales.
-
Sensitivity sweeps test how feed-purity swings or ambient-temperature changes could tip energy and utility loads.
-
Dynamic checks (where kinetics demand) confirm that start-ups, exotherms, or feed-changeovers stay inside pressure and temperature limits.
-
Scenario benchmarking lets stakeholders compare, say, a single 500-L reactor vs three 200-L trains, or column A at 10 t/d vs split columns at 5 t/d each.
These digital iterations eliminate 90 % of the “wish-we’d-known” surprises that sink budgets mid-build.
4 | Early Safety & Regulatory Framing
-
Preliminary HAZID sessions list credible worst-cases (thermal runaway, toxic vent, over-pressure) and outline first-cut layers of protection—emergency cooling, rupture discs, remote isolation.
-
Environmental screeners check whether anticipated NOₓ, VOCs, or waste-water constituents might trigger special permits. If they do, mitigation hits the concept now, not during frantic pre-startup rewrites.
-
We draft a compliance matrix referencing local codes (e.g., Thailand IEAT, US EPA, EU BAT) so every subsequent design step lines up with statutory expectations.
5 | Project Planning & Road-mapping
Phase 1 closes with a high-level execution plan:
-
Work-breakdown structure for Phase 2 and Phase 3, complete with decision gates.
-
Indicative timeline marrying long-lead equipment fabrication with site-prep milestones.
-
Risk register scoring cost, schedule, and technical threats, plus mitigation owners.
-
Test matrix detailing which KPIs (yield, purity, emissions, uptime) Phase 2 will prove and which instruments will record them.
Stakeholders now share a single vision of success, a timeline to get there, and a list of pitfalls already under guard.
6 | Deliverable: The Conceptual Design Report
-
Executive summary for decision-makers
-
Full PFD package with mass-energy data
-
Preliminary P&IDs annotated with safety notes
-
Major mechanical datasheets ready for budget quotes
-
Simulation files (.bkp / .hsc) and key plots
-
±30 % capex/opex and NPV estimate
-
Risk and regulatory compliance registers
-
Phase 2 & Phase 3 execution roadmap
Armed with this dossier, you can green-light your pilot or demo plant confident that the chemistry, economics, and logistics have passed their first real stress-test—and that every future engineering hour is aimed at a clearly framed target.
“Front-end loading is engineering’s version of compound interest: invest the effort early and the dividends keep paying through fabrication, start-up, and beyond.”
Proceed to Phase 2 only when Phase 1 is rock-solid. OSVARD ensures it is—so your scale-up stands on the firmest possible ground.