
Modern chemical plants log millions of data points every day—temperatures, flows, assays, energy meters, maintenance notes. Until those numbers are interrogated with engineering context and analytical rigor, they remain little more than digital clutter. OSVARD’s Data Analysis & Optimisation service turns that clutter into a living playbook for higher yield, lower energy, tighter quality, and smarter maintenance.
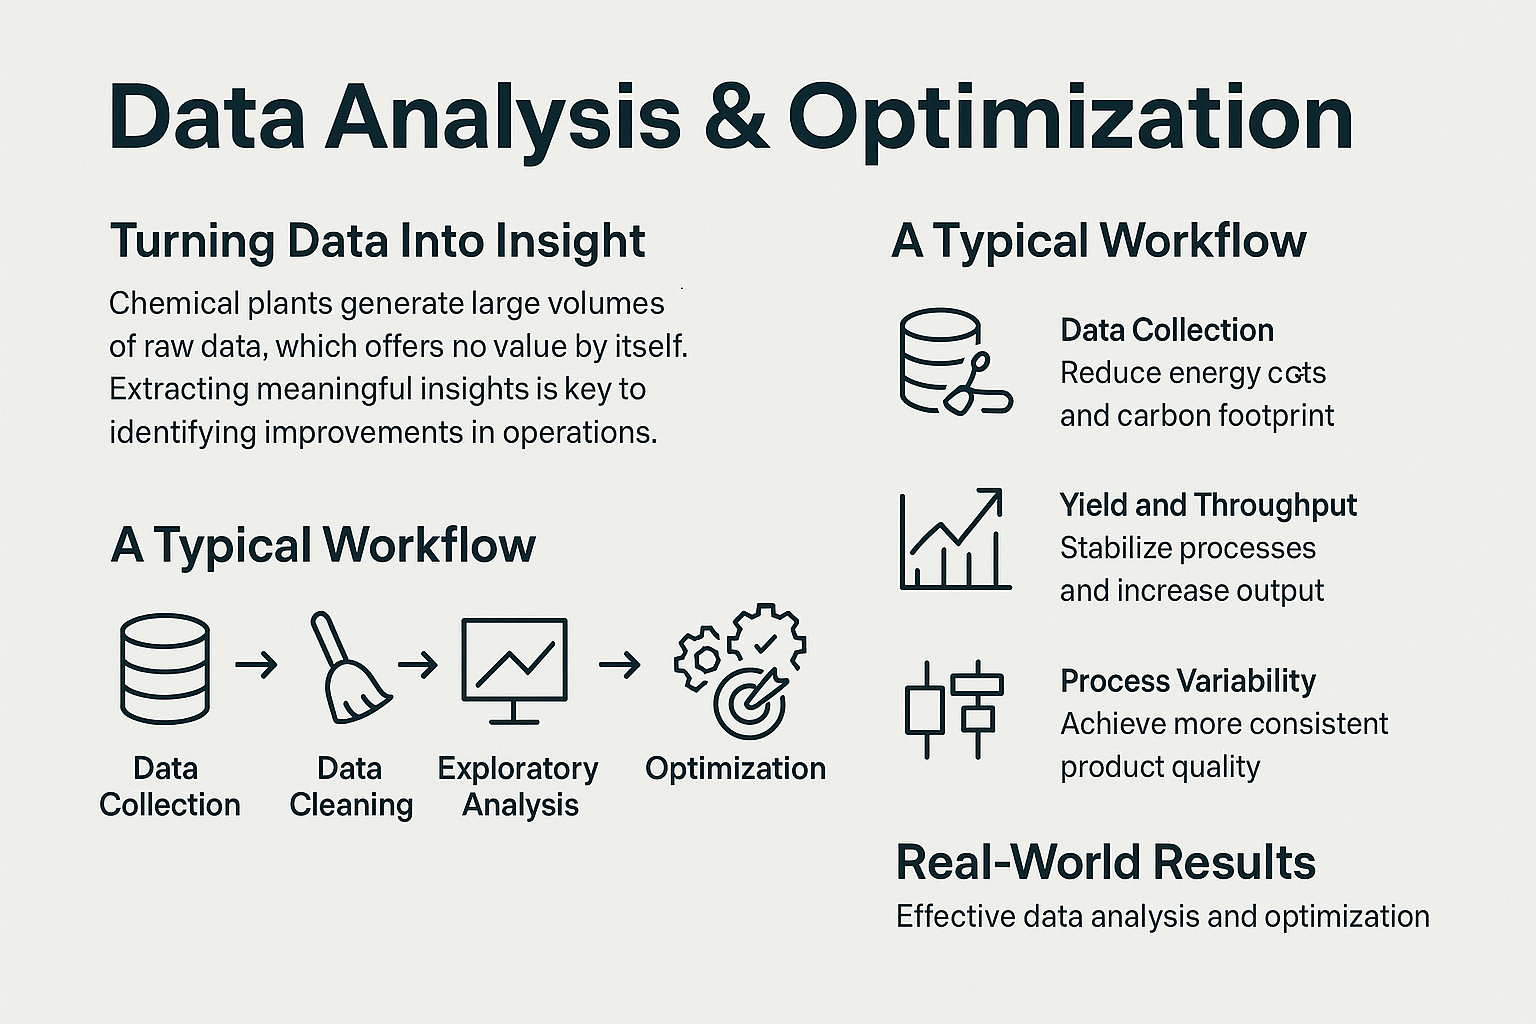
Define the goal. Together we nail down the specific business question—cut steam, lift throughput, stabilise purity, reduce downtime.
Collect and cleanse. We pull historians, MES, LIMS, spreadsheets, and logbooks, then fix gaps, drifts, and bad tags.
Explore the patterns. Using JMP, Python/Pandas, or specialist analytics platforms, we chart trends, run SPC, and uncover multivariate correlations.
Validate the cause. Every statistical hint is cross-checked against process know-how, simulation, or a controlled plant trial.
Optimise and implement. We choose the right solver—simple if possible, sophisticated if necessary—then apply set-point or procedural changes with operator buy-in.
Monitor and iterate. Dashboards track the new KPIs live; deviations trigger fresh investigation, embedding continuous improvement.
Dynamic dashboards and rich visualisation that make anomalies leap off the screen.
Classical statistics and DoE to pinpoint which inputs truly move your outputs.
Machine-learning models (clustering, random forests, neural nets) when relationships are nonlinear or hidden.
Process-simulation feedback loops—data refines models, models test ‘what-ifs’ beyond current operating space.
Mathematical programming (linear, nonlinear, mixed-integer) to juggle multiple constraints and targets simultaneously.
We never force AI where a scatter plot will do, and we never stop at pretty graphics when an optimiser can deliver hard cash.
Steam cut by 15 %: A distillation column’s spikes traced to light-feed campaigns and an aggressive reflux strategy. Fine-tuning reflux ratio and pressure slashed energy and CO₂.
Yield up 3 % in batch production: Analysis showed higher yields when a reaction step heated more slowly. Enforcing a minimum ramp time delivered a repeatable boost without lengthening the batch.
Off-spec polymer rework down 60 %: Night-shift temperature drift and raw-material purity swings were revealed; tightening specs and adding an APC loop stabilised quality.
Operator load reduced: Alarm-log mining exposed a handful of “bad actor” alarms firing hundreds of times a day. Rationalising the alarm set cut noise and sharpened operator focus.
Zero unplanned valve trips: Fouling trends indicated a three-month failure window; moving to a two-month clean-and-inspect cycle eliminated surprise shutdowns.
Most fixes involved control-logic edits or procedural tweaks—pennies to implement, yet they paid back in weeks.
Dashboards stay live so engineers and operators act on current insights, not month-old printouts.
On-the-job coaching demystifies statistics and ML, turning sceptics into champions.
Alert workflows escalate anomalies automatically—problems are tackled before they snowball.
Digital-champion squads sustain momentum long after the initial project closes.
When evidence overtakes gut feel, continuous improvement becomes routine rather than heroic.
Energy cuts of 5–15 %, yield bumps of 2–4 %, variability halved, unplanned maintenance down by a third—these are typical, not exceptional. Because the changes ride on data you already collect, capital spend is minimal and payback measured in months.
“Insight is the cheapest piece of process equipment you’ll ever install—and often the most powerful.”
Ready to hear what your data has been trying to tell you? OSVARD’s Data Analysis & Optimisation team is here to translate silent numbers into louder profits.